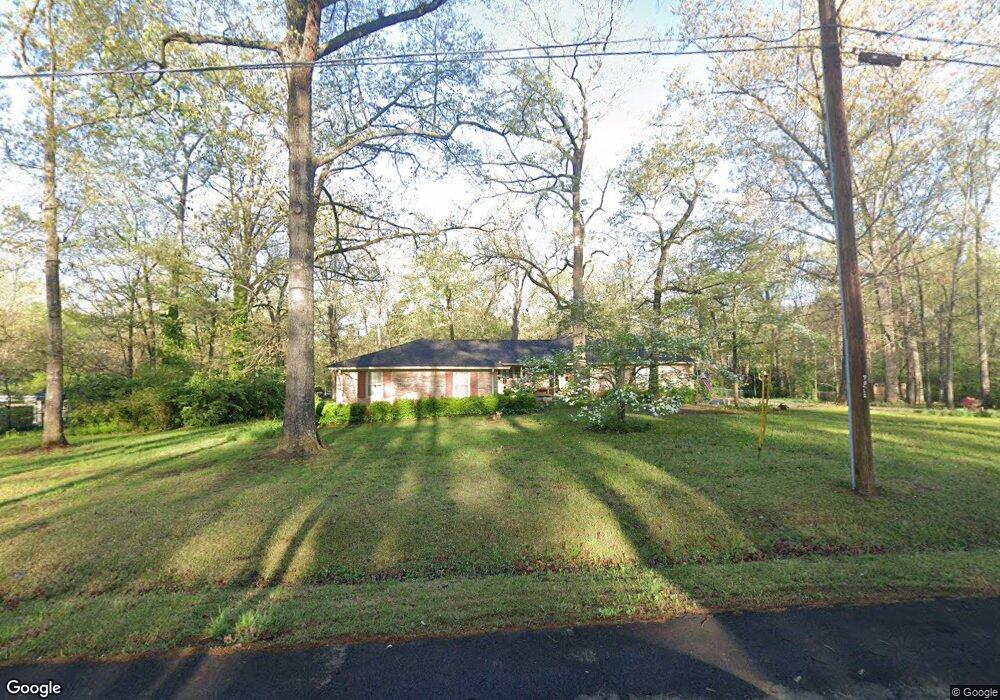
237 Cherokee Cir Cedartown, GA 30125
Estimated Value: $348,461 - $379,000
3
Beds
3
Baths
2,424
Sq Ft
$150/Sq Ft
Est. Value
About This Home
This home is located at 237 Cherokee Cir, Cedartown, GA 30125 and is currently estimated at $362,865, approximately $149 per square foot. 237 Cherokee Cir is a home located in Polk County with nearby schools including Vineyard Harvester Christian Academy and Cedar Christian School.
Ownership History
Date
Name
Owned For
Owner Type
Purchase Details
Closed on
Jul 18, 2008
Sold by
Not Provided
Bought by
Keys Carolyn S
Current Estimated Value
Home Financials for this Owner
Home Financials are based on the most recent Mortgage that was taken out on this home.
Original Mortgage
$87,000
Outstanding Balance
$56,974
Interest Rate
6.37%
Mortgage Type
New Conventional
Estimated Equity
$305,891
Purchase Details
Closed on
Aug 21, 2006
Sold by
Not Provided
Bought by
Keys Carolyn S
Purchase Details
Closed on
Jul 27, 2001
Sold by
Phillips Joyce E (Exec Of Robert E Myers
Bought by
Keys Keys B and Keys Carolyn S
Purchase Details
Closed on
Sep 25, 2000
Sold by
Myers Robert E
Bought by
Phillips Joyce E & Trust Company Of
Purchase Details
Closed on
Dec 11, 1974
Sold by
Myers Robert and Myers Betty
Bought by
Myers Robert E
Purchase Details
Closed on
Oct 12, 1971
Sold by
Jackson John E
Bought by
Myers Robert and Myers Betty
Purchase Details
Closed on
Jun 21, 1971
Bought by
Jackson John E
Create a Home Valuation Report for This Property
The Home Valuation Report is an in-depth analysis detailing your home's value as well as a comparison with similar homes in the area
Home Values in the Area
Average Home Value in this Area
Purchase History
| Date | Buyer | Sale Price | Title Company |
|---|---|---|---|
| Keys Carolyn S | -- | -- | |
| Keys Carolyn S | -- | -- | |
| Keys Keys B | $177,500 | -- | |
| Phillips Joyce E & Trust Company Of | -- | -- | |
| Myers Robert E | -- | -- | |
| Myers Robert | -- | -- | |
| Jackson John E | -- | -- |
Source: Public Records
Mortgage History
| Date | Status | Borrower | Loan Amount |
|---|---|---|---|
| Open | Keys Carolyn S | $87,000 |
Source: Public Records
Tax History Compared to Growth
Tax History
| Year | Tax Paid | Tax Assessment Tax Assessment Total Assessment is a certain percentage of the fair market value that is determined by local assessors to be the total taxable value of land and additions on the property. | Land | Improvement |
|---|---|---|---|---|
| 2024 | $2,694 | $143,614 | $12,000 | $131,614 |
| 2023 | $2,200 | $106,101 | $12,000 | $94,101 |
| 2022 | $1,849 | $91,282 | $7,200 | $84,082 |
| 2021 | $1,873 | $91,282 | $7,200 | $84,082 |
| 2020 | $1,876 | $91,282 | $7,200 | $84,082 |
| 2019 | $1,791 | $80,032 | $9,200 | $70,832 |
| 2018 | $1,693 | $74,778 | $8,050 | $66,728 |
| 2017 | $1,668 | $74,778 | $8,050 | $66,728 |
| 2016 | $1,668 | $74,778 | $8,050 | $66,728 |
| 2015 | $1,671 | $74,839 | $8,050 | $66,789 |
| 2014 | $1,680 | $74,839 | $8,050 | $66,789 |
Source: Public Records
Map
Nearby Homes
- 217 Cherokee Cir
- 727 Cherokee Rd
- 828 N College Dr
- LOT 21 Cherokee Cir
- 621 N College Dr
- 208 Silverthorn Way
- 0 Woodlawn Dr Unit 7638056
- 0 Woodlawn Dr Unit 10590789
- 0 Cave Spring Rd Unit 10631588
- 0 Cave Spring Rd Unit 7671027
- 133 Virginia Cir
- 1200 N Cave Spring St
- 95 Virginia Cir
- 64 Virginia Cir
- 112 College Cir
- 28 Summerwind Dr
- 232 Stephens Rd
- 246 Stephens Rd
- 39 Summerwind Dr
- 229 Cherokee Cir
- 241 Cherokee Cir
- 125 Cherokee Cir
- 129 Cherokee Cir Unit 69
- 129 Cherokee Cir
- 121 Cherokee Cir
- 238 Cherokee Cir
- 234 Cherokee Cir
- 133 Cherokee Cir
- 242 Cherokee Cir
- 225 Cherokee Cir
- 137 Cherokee Cir
- 108 Cherokee Cir
- 226 Cherokee Cir
- 104 Cherokee Cir
- 112 Cherokee Cir
- 124 Cherokee Cir
- 141 Cherokee Cir
- 849 N College Dr
- 130 Cherokee Cir