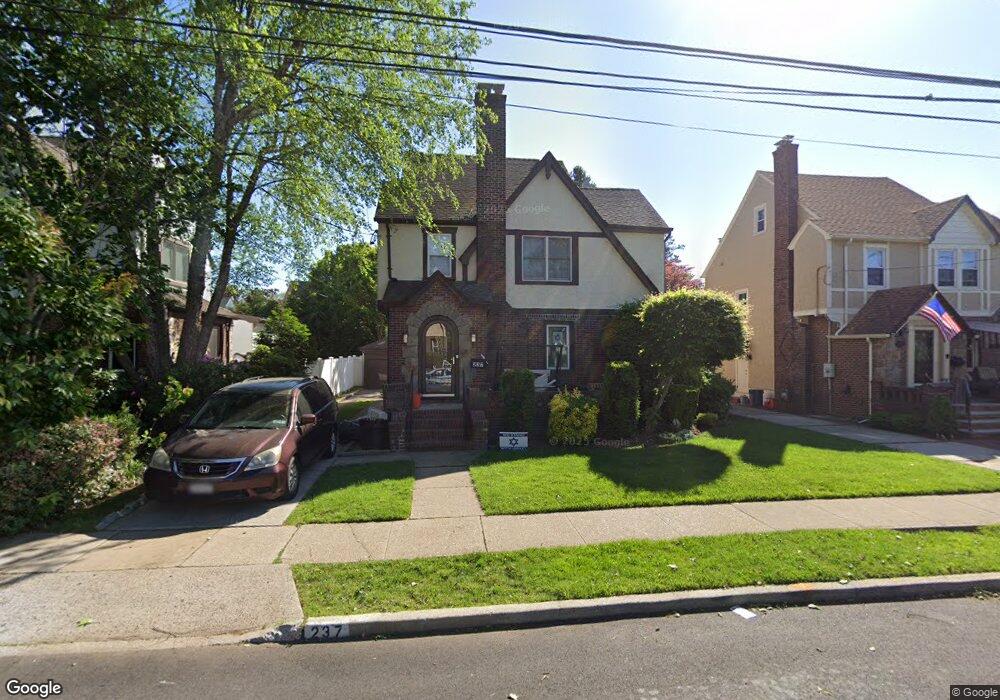
237 Colony St West Hempstead, NY 11552
Estimated Value: $857,724 - $935,000
--
Bed
4
Baths
2,208
Sq Ft
$406/Sq Ft
Est. Value
About This Home
This home is located at 237 Colony St, West Hempstead, NY 11552 and is currently estimated at $896,362, approximately $405 per square foot. 237 Colony St is a home located in Nassau County with nearby schools including Chestnut Street School, West Hempstead Secondary School, and Hebrew Academy of Nassau County (HANC).
Ownership History
Date
Name
Owned For
Owner Type
Purchase Details
Closed on
Apr 12, 2013
Sold by
Frankel Dovid M and Frankel Adina W
Bought by
Cohen Steven and Cohen Esther L
Current Estimated Value
Home Financials for this Owner
Home Financials are based on the most recent Mortgage that was taken out on this home.
Original Mortgage
$360,000
Outstanding Balance
$256,058
Interest Rate
3.64%
Estimated Equity
$640,304
Purchase Details
Closed on
Oct 5, 2000
Sold by
Gallagher Hugh P
Bought by
Frankel Dovid M
Create a Home Valuation Report for This Property
The Home Valuation Report is an in-depth analysis detailing your home's value as well as a comparison with similar homes in the area
Home Values in the Area
Average Home Value in this Area
Purchase History
| Date | Buyer | Sale Price | Title Company |
|---|---|---|---|
| Cohen Steven | $470,000 | Stewart Title Insurance Comp | |
| Frankel Dovid M | $295,000 | David Linn |
Source: Public Records
Mortgage History
| Date | Status | Borrower | Loan Amount |
|---|---|---|---|
| Open | Cohen Steven | $360,000 |
Source: Public Records
Tax History Compared to Growth
Tax History
| Year | Tax Paid | Tax Assessment Tax Assessment Total Assessment is a certain percentage of the fair market value that is determined by local assessors to be the total taxable value of land and additions on the property. | Land | Improvement |
|---|---|---|---|---|
| 2025 | $16,249 | $570 | $213 | $357 |
| 2024 | $5,152 | $596 | $222 | $374 |
| 2023 | $13,894 | $631 | $236 | $395 |
| 2022 | $13,894 | $619 | $231 | $388 |
| 2021 | $16,409 | $616 | $220 | $396 |
| 2020 | $11,528 | $658 | $385 | $273 |
| 2019 | $10,827 | $705 | $387 | $318 |
| 2018 | $10,896 | $752 | $0 | $0 |
| 2017 | $7,145 | $799 | $335 | $464 |
| 2016 | $11,135 | $846 | $355 | $491 |
| 2015 | $4,587 | $985 | $413 | $572 |
| 2014 | $4,587 | $985 | $413 | $572 |
| 2013 | $4,295 | $985 | $413 | $572 |
Source: Public Records
Map
Nearby Homes