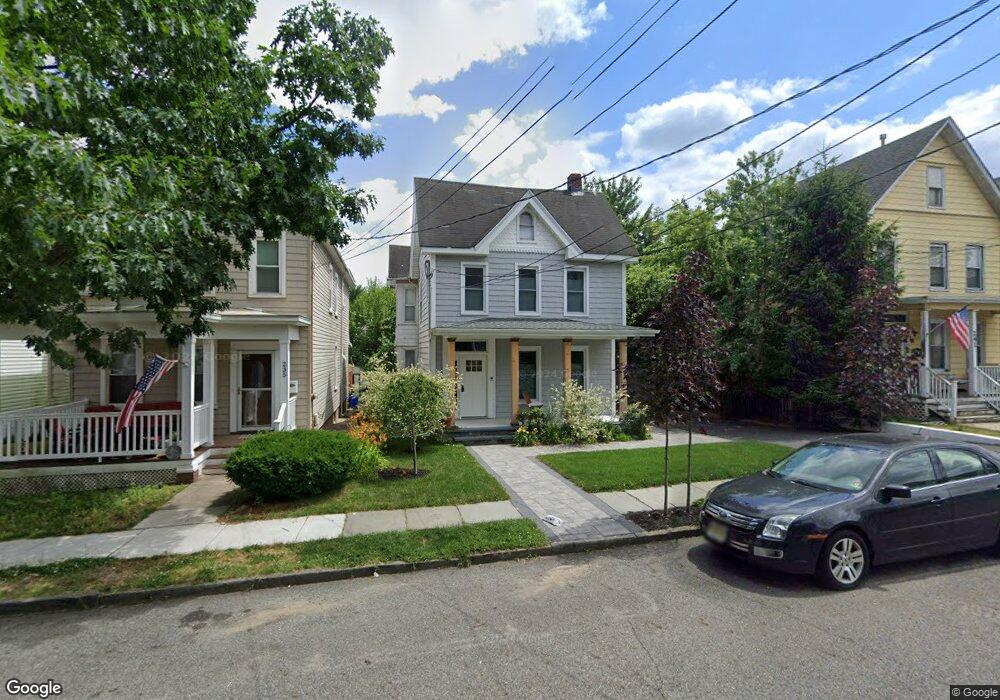
237 David St South Amboy, NJ 08879
Estimated Value: $490,000 - $551,432
--
Bed
--
Bath
2,214
Sq Ft
$236/Sq Ft
Est. Value
About This Home
This home is located at 237 David St, South Amboy, NJ 08879 and is currently estimated at $523,358, approximately $236 per square foot. 237 David St is a home located in Middlesex County with nearby schools including South Amboy Elementary School, South Amboy Middle/High School, and St. Mary Elementary School.
Ownership History
Date
Name
Owned For
Owner Type
Purchase Details
Closed on
Aug 8, 1997
Sold by
Campbell Hugh
Bought by
Winkler John and Winkler Lisa
Current Estimated Value
Home Financials for this Owner
Home Financials are based on the most recent Mortgage that was taken out on this home.
Original Mortgage
$128,000
Outstanding Balance
$19,220
Interest Rate
7.56%
Mortgage Type
VA
Estimated Equity
$504,138
Purchase Details
Closed on
Apr 27, 1995
Sold by
Minkler Janice
Bought by
Campbell Hugh
Create a Home Valuation Report for This Property
The Home Valuation Report is an in-depth analysis detailing your home's value as well as a comparison with similar homes in the area
Home Values in the Area
Average Home Value in this Area
Purchase History
| Date | Buyer | Sale Price | Title Company |
|---|---|---|---|
| Winkler John | $125,000 | -- | |
| Campbell Hugh | $67,200 | -- |
Source: Public Records
Mortgage History
| Date | Status | Borrower | Loan Amount |
|---|---|---|---|
| Open | Winkler John | $128,000 |
Source: Public Records
Tax History Compared to Growth
Tax History
| Year | Tax Paid | Tax Assessment Tax Assessment Total Assessment is a certain percentage of the fair market value that is determined by local assessors to be the total taxable value of land and additions on the property. | Land | Improvement |
|---|---|---|---|---|
| 2025 | $9,499 | $296,000 | $127,000 | $169,000 |
| 2024 | $9,140 | $296,000 | $127,000 | $169,000 |
| 2023 | $9,140 | $296,000 | $127,000 | $169,000 |
| 2022 | $8,685 | $296,000 | $127,000 | $169,000 |
| 2021 | $8,540 | $296,000 | $127,000 | $169,000 |
| 2020 | $8,338 | $296,000 | $127,000 | $169,000 |
| 2019 | $8,205 | $296,000 | $127,000 | $169,000 |
| 2018 | $8,137 | $296,000 | $127,000 | $169,000 |
| 2017 | $8,007 | $296,000 | $127,000 | $169,000 |
| 2016 | $7,806 | $296,000 | $127,000 | $169,000 |
| 2015 | $7,862 | $296,000 | $127,000 | $169,000 |
| 2014 | $7,592 | $296,000 | $127,000 | $169,000 |
Source: Public Records
Map
Nearby Homes