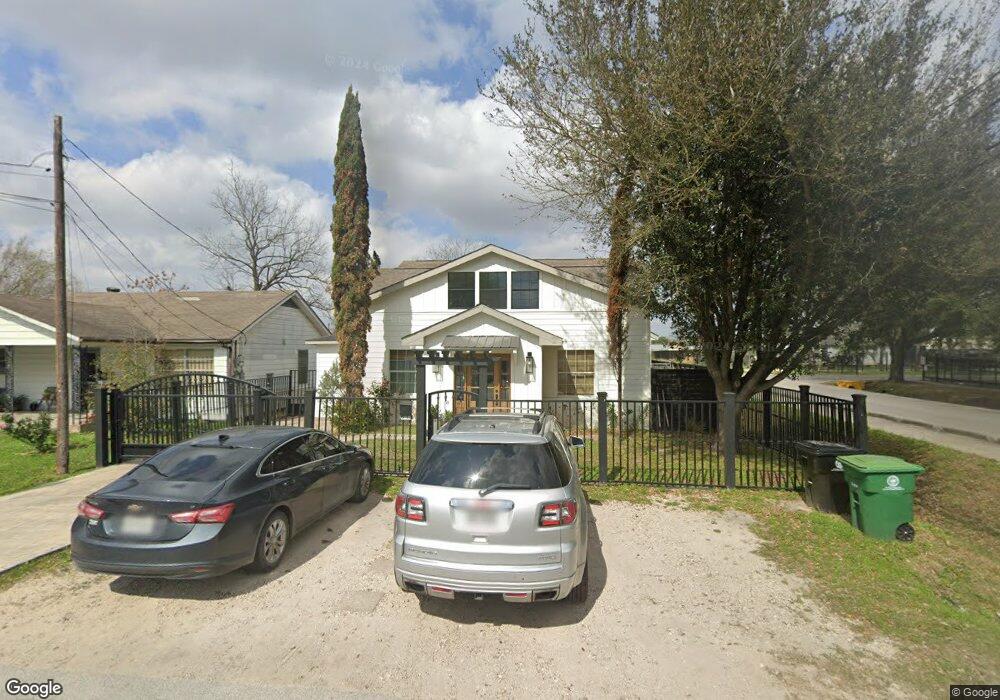
237 Fichter St Houston, TX 77022
Northside-Northline NeighborhoodEstimated Value: $236,000 - $329,000
3
Beds
2
Baths
1,216
Sq Ft
$240/Sq Ft
Est. Value
About This Home
This home is located at 237 Fichter St, Houston, TX 77022 and is currently estimated at $291,470, approximately $239 per square foot. 237 Fichter St is a home located in Harris County with nearby schools including Burbank Elementary School, Burbank Middle School, and Sam Houston Math, Science & Technology Center.
Ownership History
Date
Name
Owned For
Owner Type
Purchase Details
Closed on
Feb 28, 2005
Sold by
Mclane Peggy
Bought by
Macias Dario J
Current Estimated Value
Home Financials for this Owner
Home Financials are based on the most recent Mortgage that was taken out on this home.
Original Mortgage
$72,999
Outstanding Balance
$37,253
Interest Rate
5.71%
Mortgage Type
Stand Alone First
Estimated Equity
$254,217
Create a Home Valuation Report for This Property
The Home Valuation Report is an in-depth analysis detailing your home's value as well as a comparison with similar homes in the area
Home Values in the Area
Average Home Value in this Area
Purchase History
| Date | Buyer | Sale Price | Title Company |
|---|---|---|---|
| Macias Dario J | -- | Startex 07 Title Company | |
| Mclane Peggy J | -- | Startex 07 Title Company |
Source: Public Records
Mortgage History
| Date | Status | Borrower | Loan Amount |
|---|---|---|---|
| Open | Macias Dario J | $72,999 |
Source: Public Records
Tax History Compared to Growth
Tax History
| Year | Tax Paid | Tax Assessment Tax Assessment Total Assessment is a certain percentage of the fair market value that is determined by local assessors to be the total taxable value of land and additions on the property. | Land | Improvement |
|---|---|---|---|---|
| 2025 | $3,841 | $302,083 | $76,000 | $226,083 |
| 2024 | $3,841 | $291,831 | $69,750 | $222,081 |
| 2023 | $3,841 | $347,053 | $42,500 | $304,553 |
| 2022 | $5,111 | $281,856 | $42,500 | $239,356 |
| 2021 | $4,918 | $218,847 | $42,500 | $176,347 |
| 2020 | $4,645 | $196,844 | $42,500 | $154,344 |
| 2019 | $3,535 | $157,645 | $35,000 | $122,645 |
| 2018 | $2,282 | $127,000 | $29,250 | $97,750 |
| 2017 | $2,958 | $127,000 | $29,250 | $97,750 |
| 2016 | $2,689 | $111,930 | $27,500 | $84,430 |
| 2015 | $1,819 | $96,691 | $20,000 | $76,691 |
| 2014 | $1,819 | $96,691 | $20,000 | $76,691 |
Source: Public Records
Map
Nearby Homes
- 216 Burress St
- 253 De Boll St
- 249 De Boll St
- 132 Grothe Ln
- 108 Fichter St
- 318 Charlock St
- 9026 Mcgallion Rd
- 411 Berry Rd
- 90 Burress St Unit B
- 90 Burress St Unit A
- 88 Berry Rd
- 61 Trenwood Ln
- 702 Pennington St
- 70 Burress St
- 8205 Appleton St
- 235 Julia St Unit B
- 807 Firnat St
- 56 Wellford St
- 723 Doverside St
- 202 Burbank St