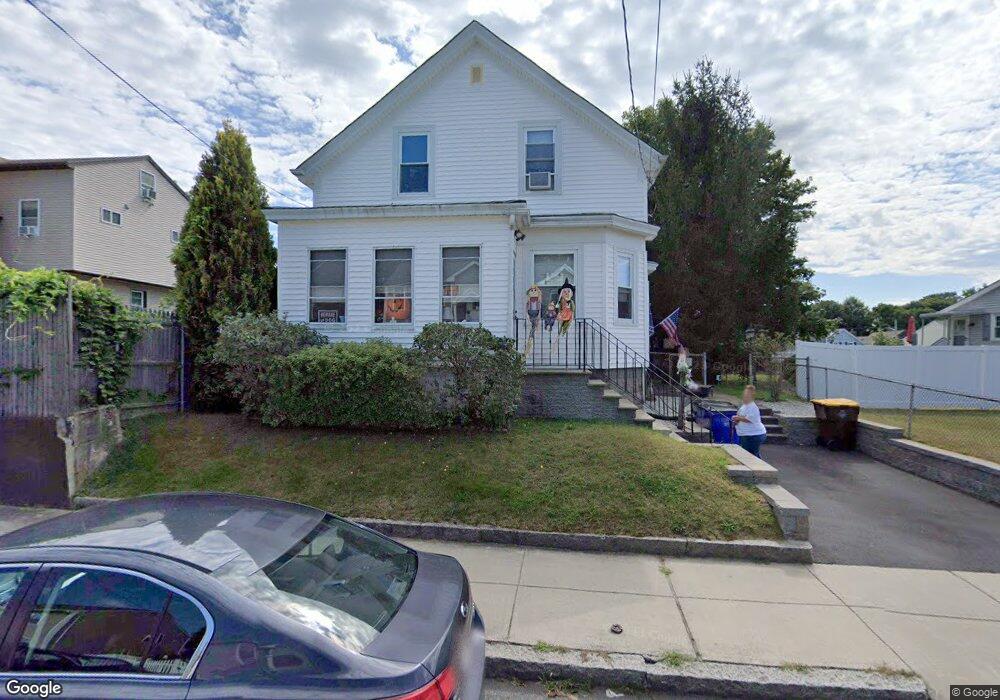
237 Field St Fall River, MA 02721
Maplewood NeighborhoodEstimated Value: $317,000 - $429,000
3
Beds
1
Bath
975
Sq Ft
$388/Sq Ft
Est. Value
About This Home
This home is located at 237 Field St, Fall River, MA 02721 and is currently estimated at $377,915, approximately $387 per square foot. 237 Field St is a home located in Bristol County with nearby schools including Letourneau Elementary School, Matthew J. Kuss Middle School, and B M C Durfee High School.
Ownership History
Date
Name
Owned For
Owner Type
Purchase Details
Closed on
Jun 30, 1998
Sold by
Cateon Michael F and Cateon Donna M
Bought by
Sousa Luis A and Sousa Louella D
Current Estimated Value
Home Financials for this Owner
Home Financials are based on the most recent Mortgage that was taken out on this home.
Original Mortgage
$108,068
Outstanding Balance
$22,289
Interest Rate
7.09%
Mortgage Type
Purchase Money Mortgage
Estimated Equity
$355,626
Create a Home Valuation Report for This Property
The Home Valuation Report is an in-depth analysis detailing your home's value as well as a comparison with similar homes in the area
Home Values in the Area
Average Home Value in this Area
Purchase History
| Date | Buyer | Sale Price | Title Company |
|---|---|---|---|
| Sousa Luis A | $108,000 | -- |
Source: Public Records
Mortgage History
| Date | Status | Borrower | Loan Amount |
|---|---|---|---|
| Open | Sousa Luis A | $108,068 | |
| Previous Owner | Sousa Luis A | $6,000 | |
| Previous Owner | Sousa Luis A | $41,000 |
Source: Public Records
Tax History
| Year | Tax Paid | Tax Assessment Tax Assessment Total Assessment is a certain percentage of the fair market value that is determined by local assessors to be the total taxable value of land and additions on the property. | Land | Improvement |
|---|---|---|---|---|
| 2025 | $3,369 | $294,200 | $124,900 | $169,300 |
| 2024 | $3,176 | $276,400 | $120,100 | $156,300 |
| 2023 | $2,936 | $239,300 | $103,000 | $136,300 |
| 2022 | $2,710 | $214,700 | $93,600 | $121,100 |
| 2021 | $2,531 | $183,000 | $86,600 | $96,400 |
| 2020 | $2,530 | $175,100 | $82,900 | $92,200 |
| 2019 | $2,419 | $165,900 | $79,000 | $86,900 |
| 2018 | $2,231 | $152,600 | $77,500 | $75,100 |
| 2017 | $2,149 | $153,500 | $79,100 | $74,400 |
| 2016 | $2,085 | $153,000 | $82,400 | $70,600 |
| 2015 | $1,961 | $149,900 | $79,300 | $70,600 |
| 2014 | $1,939 | $154,100 | $83,500 | $70,600 |
Source: Public Records
Map
Nearby Homes
Your Personal Tour Guide
Ask me questions while you tour the home.