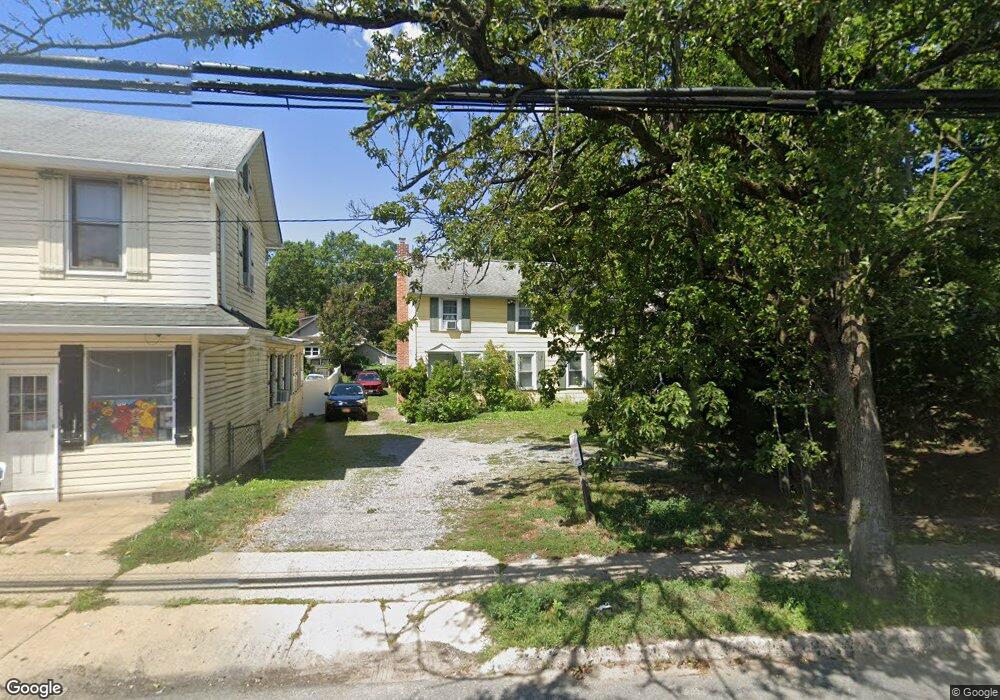
237 Glen Cove Ave Sea Cliff, NY 11579
Estimated Value: $813,000 - $955,485
4
Beds
2
Baths
1,588
Sq Ft
$557/Sq Ft
Est. Value
About This Home
This home is located at 237 Glen Cove Ave, Sea Cliff, NY 11579 and is currently estimated at $884,243, approximately $556 per square foot. 237 Glen Cove Ave is a home located in Nassau County with nearby schools including North Shore Middle School, North Shore Senior High School, and Tiegerman Elementary School.
Ownership History
Date
Name
Owned For
Owner Type
Purchase Details
Closed on
Oct 21, 2022
Sold by
Moser Walter P
Bought by
Basher Md Shafiul and Khondoker Amina K
Current Estimated Value
Home Financials for this Owner
Home Financials are based on the most recent Mortgage that was taken out on this home.
Original Mortgage
$517,500
Outstanding Balance
$497,393
Interest Rate
5.87%
Mortgage Type
New Conventional
Estimated Equity
$386,850
Purchase Details
Closed on
Jan 31, 2022
Sold by
Mosser Elizabeth A
Bought by
Mosser Walter P
Purchase Details
Closed on
May 18, 2007
Sold by
Chen Amie
Bought by
Moser Elizabeth
Purchase Details
Closed on
Jul 28, 2005
Sold by
Hynes Michael
Bought by
Chen Amie
Purchase Details
Closed on
Jul 29, 1999
Sold by
Berka Marie T and Berka Richard J
Bought by
Hynes Michael
Create a Home Valuation Report for This Property
The Home Valuation Report is an in-depth analysis detailing your home's value as well as a comparison with similar homes in the area
Home Values in the Area
Average Home Value in this Area
Purchase History
| Date | Buyer | Sale Price | Title Company |
|---|---|---|---|
| Basher Md Shafiul | $690,000 | Fidelity National Ttl Ins Co | |
| Mosser Walter P | -- | All New York Title Agcy Inc | |
| Moser Elizabeth | $582,000 | -- | |
| Chen Amie | $560,000 | -- | |
| Hynes Michael | $149,000 | -- |
Source: Public Records
Mortgage History
| Date | Status | Borrower | Loan Amount |
|---|---|---|---|
| Open | Basher Md Shafiul | $517,500 |
Source: Public Records
Tax History Compared to Growth
Tax History
| Year | Tax Paid | Tax Assessment Tax Assessment Total Assessment is a certain percentage of the fair market value that is determined by local assessors to be the total taxable value of land and additions on the property. | Land | Improvement |
|---|---|---|---|---|
| 2025 | $11,095 | $536 | $219 | $317 |
| 2024 | $2,117 | $525 | $215 | $310 |
| 2023 | $9,983 | $536 | $219 | $317 |
| 2022 | $9,983 | $536 | $219 | $317 |
| 2021 | $8,203 | $516 | $211 | $305 |
| 2020 | $9,446 | $833 | $803 | $30 |
| 2019 | $2,374 | $893 | $807 | $86 |
| 2018 | $8,431 | $953 | $0 | $0 |
| 2017 | $8,431 | $1,133 | $861 | $272 |
| 2016 | $11,248 | $1,133 | $861 | $272 |
| 2015 | $2,435 | $1,133 | $861 | $272 |
| 2014 | $2,435 | $1,133 | $861 | $272 |
| 2013 | $2,299 | $1,133 | $861 | $272 |
Source: Public Records
Map
Nearby Homes
- 239 Glen Cove Ave
- 233 Glen Cove Ave
- 9 Grove St
- 11 Grove St
- 5 Grove St
- 15 Grove St
- 231 Glen Cove Ave
- 1 Grove St
- 6 Lafayette Ave
- 8 Lafayette Ave
- 226 Glen Cove Ave Unit 2nd Fl
- 226 Glen Cove Ave Unit 1st Fl
- 6 Littleworth Ln
- 12 Grove St
- 8 Littleworth Ln
- 229 Glen Cove Ave
- 229 Glen Cove Ave
- 10 Grove St
- 15 Littleworth Ln
- 12 Lafayette Ave