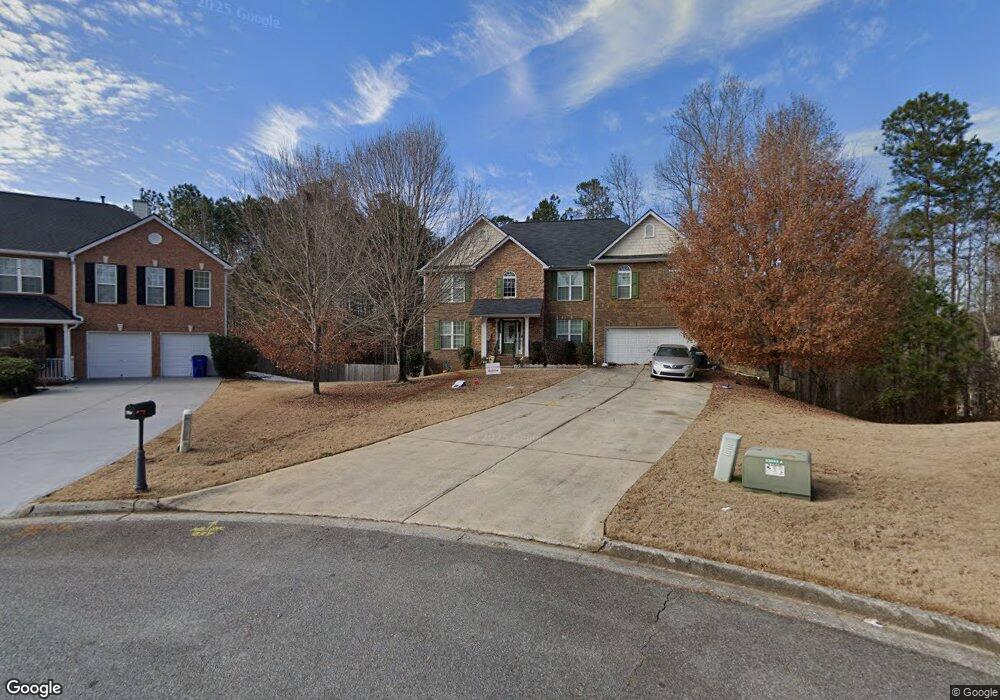
237 Hickory Branch Dr Acworth, GA 30101
Cedarcrest NeighborhoodEstimated Value: $433,000 - $515,000
4
Beds
3
Baths
3,132
Sq Ft
$148/Sq Ft
Est. Value
About This Home
This home is located at 237 Hickory Branch Dr, Acworth, GA 30101 and is currently estimated at $462,682, approximately $147 per square foot. 237 Hickory Branch Dr is a home located in Paulding County with nearby schools including Roland W. Russom Elementary School, East Paulding Middle School, and North Paulding High School.
Ownership History
Date
Name
Owned For
Owner Type
Purchase Details
Closed on
Jul 23, 2009
Sold by
Altidor Marie S
Bought by
Altidor Joseph D and Altidor Marie S
Current Estimated Value
Home Financials for this Owner
Home Financials are based on the most recent Mortgage that was taken out on this home.
Original Mortgage
$181,649
Outstanding Balance
$118,917
Interest Rate
5.37%
Mortgage Type
FHA
Estimated Equity
$343,765
Create a Home Valuation Report for This Property
The Home Valuation Report is an in-depth analysis detailing your home's value as well as a comparison with similar homes in the area
Home Values in the Area
Average Home Value in this Area
Purchase History
| Date | Buyer | Sale Price | Title Company |
|---|---|---|---|
| Altidor Joseph D | -- | -- | |
| Altidor Marie S | $185,000 | -- |
Source: Public Records
Mortgage History
| Date | Status | Borrower | Loan Amount |
|---|---|---|---|
| Open | Altidor Marie S | $181,649 |
Source: Public Records
Tax History Compared to Growth
Tax History
| Year | Tax Paid | Tax Assessment Tax Assessment Total Assessment is a certain percentage of the fair market value that is determined by local assessors to be the total taxable value of land and additions on the property. | Land | Improvement |
|---|---|---|---|---|
| 2024 | $4,080 | $164,000 | $14,000 | $150,000 |
| 2023 | $3,946 | $151,360 | $14,000 | $137,360 |
| 2022 | $3,567 | $136,840 | $14,000 | $122,840 |
| 2021 | $3,585 | $123,360 | $14,000 | $109,360 |
| 2020 | $3,224 | $108,560 | $14,000 | $94,560 |
| 2019 | $3,289 | $109,160 | $14,000 | $95,160 |
| 2018 | $3,191 | $105,920 | $14,000 | $91,920 |
| 2017 | $2,380 | $77,920 | $14,000 | $63,920 |
| 2016 | $2,211 | $73,120 | $14,000 | $59,120 |
| 2015 | $2,440 | $79,280 | $14,000 | $65,280 |
| 2014 | $2,319 | $73,480 | $14,000 | $59,480 |
| 2013 | -- | $52,800 | $14,000 | $38,800 |
Source: Public Records
Map
Nearby Homes
- 231 Hickory Branch Dr
- 234 Hickory Branch Dr
- 30 Branch Ct
- 223 Hickory Branch Dr
- 3 Wesley Dr
- 478 Heights Ln
- 11 Wesley Dr
- 490 Heights Ln
- 22 Branch Ct
- 218 Hickory Branch Dr
- 228 Hickory Branch Dr
- 38 Branch Ct
- 23 Hickory Creek Ln
- 1 Wesley Dr
- 489 Heights Ln
- 194 Hickory Branch Dr
- 45 Wesley Dr
- 33 Hickory Creek Ln
- 6399 Seymour Ct NW
- 174 Hickory Branch Dr