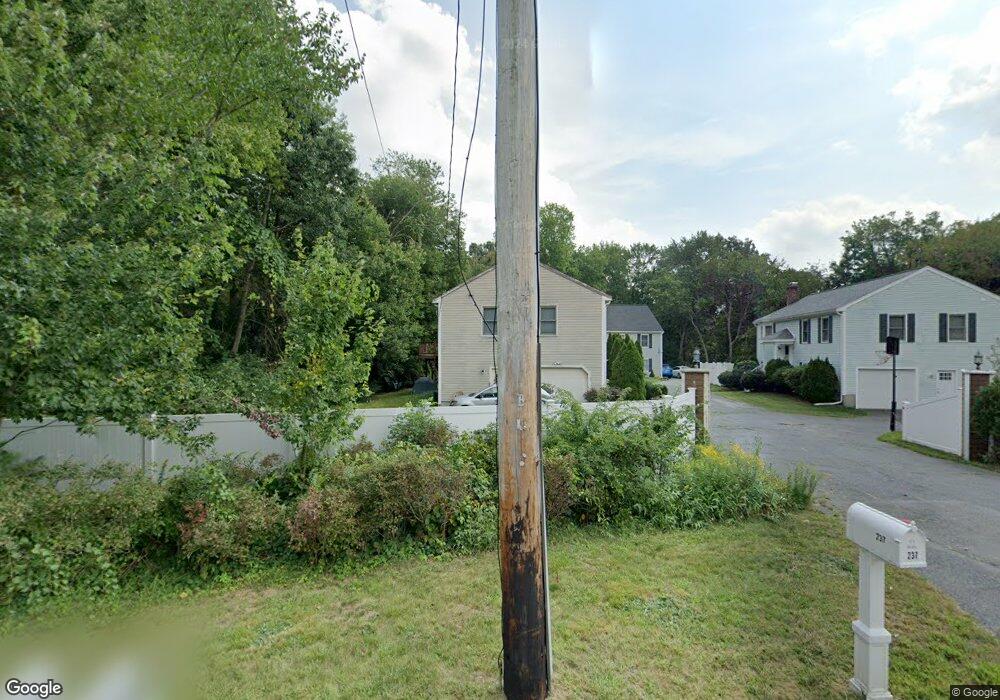
237 Main St Medway, MA 02053
Estimated Value: $608,000 - $672,000
3
Beds
2
Baths
1,144
Sq Ft
$558/Sq Ft
Est. Value
About This Home
This home is located at 237 Main St, Medway, MA 02053 and is currently estimated at $638,830, approximately $558 per square foot. 237 Main St is a home located in Norfolk County with nearby schools including John D. McGovern Elementary School, Burke-Memorial Elementary, and Medway Middle School.
Ownership History
Date
Name
Owned For
Owner Type
Purchase Details
Closed on
Jul 15, 1998
Sold by
Roches Bldg Co Inc
Bought by
Abbene Robert L and Abbene Elise T
Current Estimated Value
Home Financials for this Owner
Home Financials are based on the most recent Mortgage that was taken out on this home.
Original Mortgage
$166,250
Interest Rate
6.98%
Mortgage Type
Purchase Money Mortgage
Create a Home Valuation Report for This Property
The Home Valuation Report is an in-depth analysis detailing your home's value as well as a comparison with similar homes in the area
Home Values in the Area
Average Home Value in this Area
Purchase History
| Date | Buyer | Sale Price | Title Company |
|---|---|---|---|
| Abbene Robert L | $175,000 | -- |
Source: Public Records
Mortgage History
| Date | Status | Borrower | Loan Amount |
|---|---|---|---|
| Open | Abbene Robert L | $256,000 | |
| Closed | Abbene Robert L | $204,000 | |
| Closed | Abbene Robert L | $166,250 |
Source: Public Records
Tax History Compared to Growth
Tax History
| Year | Tax Paid | Tax Assessment Tax Assessment Total Assessment is a certain percentage of the fair market value that is determined by local assessors to be the total taxable value of land and additions on the property. | Land | Improvement |
|---|---|---|---|---|
| 2025 | $7,451 | $522,900 | $248,100 | $274,800 |
| 2024 | $7,530 | $522,900 | $248,100 | $274,800 |
| 2023 | $7,650 | $479,900 | $216,600 | $263,300 |
| 2022 | $7,016 | $414,400 | $183,100 | $231,300 |
| 2021 | $6,928 | $396,800 | $165,400 | $231,400 |
| 2020 | $6,522 | $372,700 | $145,700 | $227,000 |
| 2019 | $6,376 | $375,700 | $157,500 | $218,200 |
| 2018 | $5,865 | $332,100 | $118,200 | $213,900 |
| 2017 | $5,912 | $329,900 | $118,200 | $211,700 |
| 2016 | $5,524 | $305,000 | $93,300 | $211,700 |
| 2015 | $5,603 | $307,200 | $93,300 | $213,900 |
| 2014 | $4,459 | $236,700 | $107,600 | $129,100 |
Source: Public Records
Map
Nearby Homes
- 220 Main St Unit 220
- 5 Fales St
- 6 Freedom Trail
- 39 West St
- 462 Hartford Ave
- 28 Wellington St
- 21 Riverside Rd
- 176 Main St Unit 3
- 455 Hartford Ave
- 18 Mary Anne Dr
- 0 Old Log Lane (Farm St) Unit 73416329
- 4 Shaw St
- 14 Hawthorne Village Unit D
- 280 Village St Unit D2
- 951 Pond St
- 387 Hartford Ave
- 9 Tulip Way
- 22 Granite St
- 4 Deerfield Rd
- 6 Rainbow Dr