Estimated Value: $169,000
--
Bed
--
Bath
--
Sq Ft
--
Built
About This Home
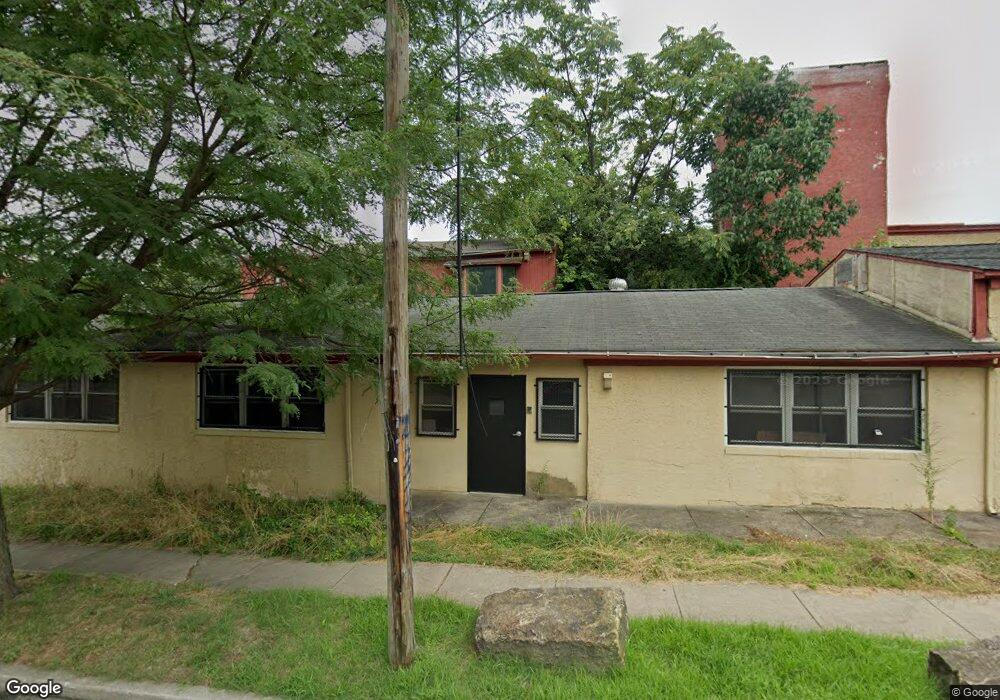
This home is located at 237 Mill St, Darby, PA 19023 and is currently priced at $169,000. 237 Mill St is a home located in Delaware County with nearby schools including Park Lane Elementary School, Penn Wood Middle School, and Penn Wood High School - Cypress Street Campus.
Ownership History
Date
Name
Owned For
Owner Type
Purchase Details
Closed on
Jul 17, 2024
Sold by
Mill Creek Holdings I Llc
Bought by
Rowhani Investments Llc
Current Estimated Value
Purchase Details
Closed on
Jun 30, 2020
Sold by
Sentry Paint Technologies Inc
Bought by
Mill Creek Holdings 1 Llc
Home Financials for this Owner
Home Financials are based on the most recent Mortgage that was taken out on this home.
Original Mortgage
$150,000
Interest Rate
3.1%
Mortgage Type
Commercial
Purchase Details
Closed on
May 3, 1979
Sold by
Freid Samuel
Bought by
Sentry Paint & Chemical Co Inc and C
Create a Home Valuation Report for This Property
The Home Valuation Report is an in-depth analysis detailing your home's value as well as a comparison with similar homes in the area
Home Values in the Area
Average Home Value in this Area
Purchase History
| Date | Buyer | Sale Price | Title Company |
|---|---|---|---|
| Rowhani Investments Llc | $450,000 | None Listed On Document | |
| Mill Creek Holdings 1 Llc | $250,000 | Transfer Re Intelligence & T | |
| Sentry Paint & Chemical Co Inc | $50,000 | -- |
Source: Public Records
Mortgage History
| Date | Status | Borrower | Loan Amount |
|---|---|---|---|
| Previous Owner | Mill Creek Holdings 1 Llc | $150,000 |
Source: Public Records
Tax History Compared to Growth
Tax History
| Year | Tax Paid | Tax Assessment Tax Assessment Total Assessment is a certain percentage of the fair market value that is determined by local assessors to be the total taxable value of land and additions on the property. | Land | Improvement |
|---|---|---|---|---|
| 2025 | $2,439 | $49,250 | $49,250 | -- |
| 2024 | $2,439 | $49,250 | $49,250 | -- |
| 2023 | $2,295 | $49,250 | $49,250 | $0 |
| 2022 | $2,232 | $49,250 | $49,250 | $0 |
| 2021 | $3,115 | $49,250 | $49,250 | $0 |
| 2020 | $4,602 | $63,000 | $51,300 | $11,700 |
| 2019 | $4,407 | $63,000 | $51,300 | $11,700 |
| 2018 | $4,353 | $63,000 | $0 | $0 |
| 2017 | $4,273 | $63,000 | $0 | $0 |
| 2016 | $353 | $63,000 | $0 | $0 |
| 2015 | $353 | $63,000 | $0 | $0 |
| 2014 | $353 | $63,000 | $0 | $0 |
Source: Public Records
Map
Nearby Homes