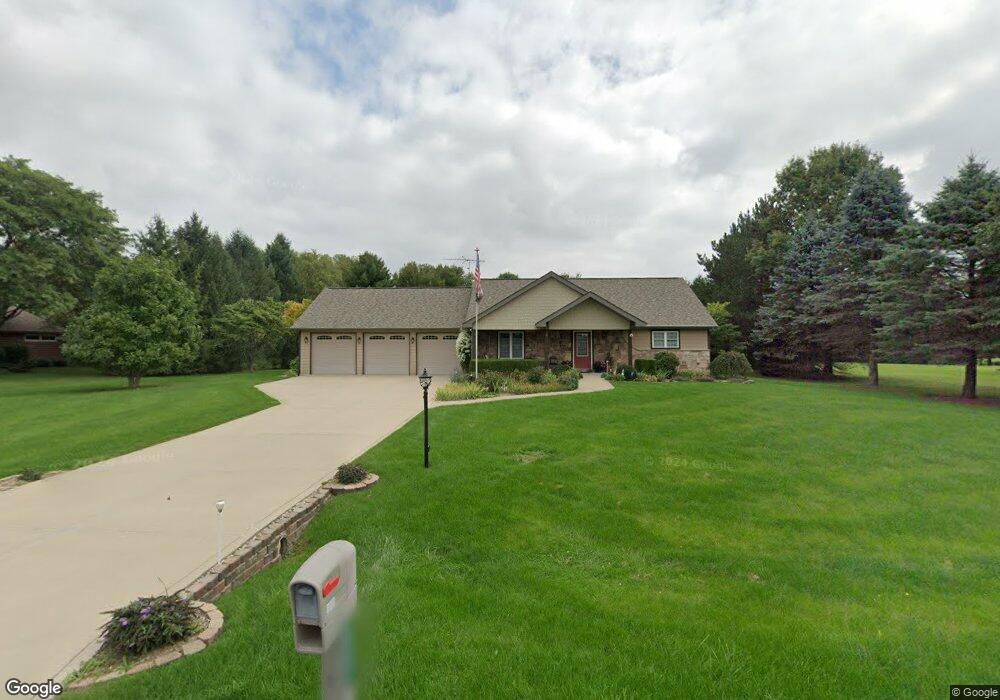
237 Norcross Dr Valparaiso, IN 46383
Porter County NeighborhoodEstimated Value: $401,000 - $433,000
3
Beds
2
Baths
1,952
Sq Ft
$214/Sq Ft
Est. Value
About This Home
This home is located at 237 Norcross Dr, Valparaiso, IN 46383 and is currently estimated at $418,594, approximately $214 per square foot. 237 Norcross Dr is a home located in Porter County with nearby schools including Morgan Township Elementary School and Morgan Township Middle/High School.
Ownership History
Date
Name
Owned For
Owner Type
Purchase Details
Closed on
Jul 15, 2005
Sold by
Bucher Construction
Bought by
Bridy Daniel L and Bridy Christine P
Current Estimated Value
Home Financials for this Owner
Home Financials are based on the most recent Mortgage that was taken out on this home.
Original Mortgage
$80,000
Outstanding Balance
$23,082
Interest Rate
5.71%
Mortgage Type
Fannie Mae Freddie Mac
Estimated Equity
$395,512
Purchase Details
Closed on
Jul 14, 2005
Sold by
Bucher Dean A and Bucher Patricia
Bought by
Bucher Construction
Home Financials for this Owner
Home Financials are based on the most recent Mortgage that was taken out on this home.
Original Mortgage
$80,000
Outstanding Balance
$23,082
Interest Rate
5.71%
Mortgage Type
Fannie Mae Freddie Mac
Estimated Equity
$395,512
Create a Home Valuation Report for This Property
The Home Valuation Report is an in-depth analysis detailing your home's value as well as a comparison with similar homes in the area
Home Values in the Area
Average Home Value in this Area
Purchase History
| Date | Buyer | Sale Price | Title Company |
|---|---|---|---|
| Bridy Daniel L | -- | Ticor Title Insurance | |
| Bucher Construction | -- | Ticor Title Insurance |
Source: Public Records
Mortgage History
| Date | Status | Borrower | Loan Amount |
|---|---|---|---|
| Open | Bridy Daniel L | $80,000 |
Source: Public Records
Tax History
| Year | Tax Paid | Tax Assessment Tax Assessment Total Assessment is a certain percentage of the fair market value that is determined by local assessors to be the total taxable value of land and additions on the property. | Land | Improvement |
|---|---|---|---|---|
| 2025 | $2,430 | $401,100 | $63,900 | $337,200 |
| 2024 | $2,342 | $401,000 | $42,600 | $358,400 |
| 2023 | $2,202 | $376,200 | $38,700 | $337,500 |
| 2022 | $2,131 | $340,900 | $38,700 | $302,200 |
| 2021 | $2,065 | $305,800 | $38,700 | $267,100 |
| 2020 | $1,817 | $278,400 | $33,700 | $244,700 |
| 2019 | $1,737 | $262,200 | $33,700 | $228,500 |
| 2018 | $1,625 | $251,900 | $33,700 | $218,200 |
| 2017 | $1,618 | $253,500 | $33,700 | $219,800 |
| 2016 | $1,255 | $216,900 | $30,900 | $186,000 |
| 2014 | $1,530 | $206,800 | $29,900 | $176,900 |
| 2013 | -- | $197,000 | $30,300 | $166,700 |
Source: Public Records
Map
Nearby Homes
- 323 E 124 S
- 0 Smoke Rd
- 48 E Division Rd
- 124 S Smoke Rd
- 3252 Mockingbird Ln
- 3253 Mockingbird Ln
- 6775 E 103rd Ln
- 2651 Woodbine Dr
- 3152 Heavilin Rd
- 421 Amy Rose Ln
- 188 Goodview Dr
- 430 Oak Breeze Dr
- 1954 Lawndale Dr
- 3906 Murvihill Rd
- 0 Parcel A 325 E
- 0 Parcel B 325 E
- 168 Jamestown Ave
- 2658 Arran Quay Terrace
- 1556 Smoke Rd
- 645 S 150 E
Your Personal Tour Guide
Ask me questions while you tour the home.