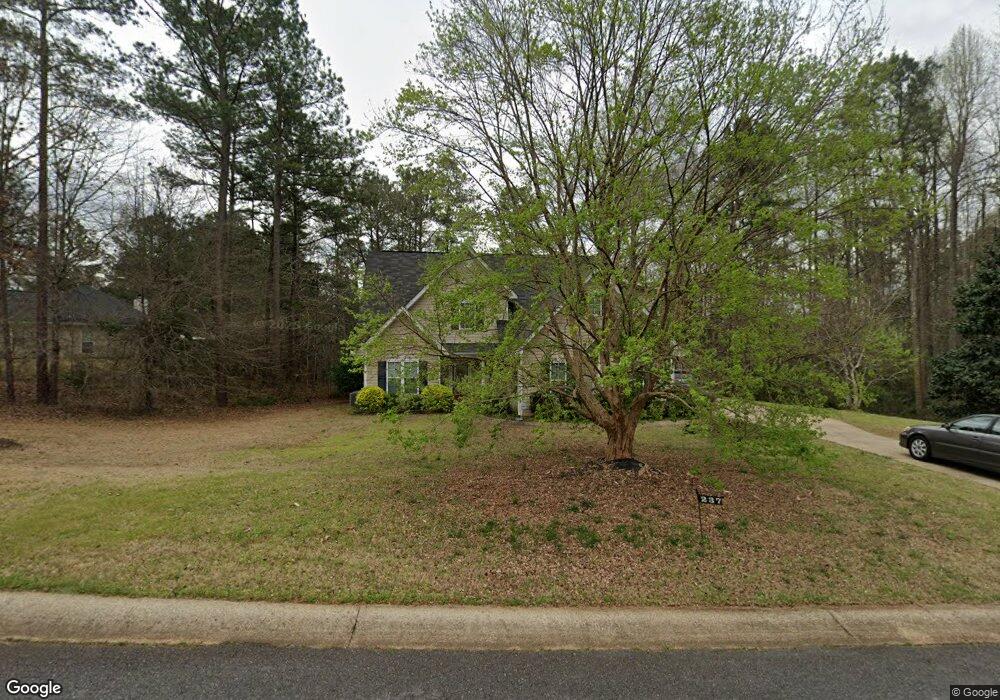
237 Old Pond Rd Lagrange, GA 30241
Estimated Value: $286,000 - $293,000
4
Beds
3
Baths
1,965
Sq Ft
$147/Sq Ft
Est. Value
About This Home
This home is located at 237 Old Pond Rd, Lagrange, GA 30241 and is currently estimated at $289,393, approximately $147 per square foot. 237 Old Pond Rd is a home located in Troup County with nearby schools including Callaway Elementary School, Hogansville Elementary School, and Callaway Middle School.
Ownership History
Date
Name
Owned For
Owner Type
Purchase Details
Closed on
Oct 19, 2012
Sold by
Chandler Danny J
Bought by
Brooks Gregory A
Current Estimated Value
Home Financials for this Owner
Home Financials are based on the most recent Mortgage that was taken out on this home.
Original Mortgage
$143,010
Outstanding Balance
$98,061
Interest Rate
3.53%
Mortgage Type
VA
Estimated Equity
$191,332
Purchase Details
Closed on
Oct 25, 2006
Sold by
Poole Susan W
Bought by
Chandler Danny J
Home Financials for this Owner
Home Financials are based on the most recent Mortgage that was taken out on this home.
Original Mortgage
$138,000
Interest Rate
6.27%
Mortgage Type
New Conventional
Purchase Details
Closed on
Jun 30, 2004
Sold by
Traditional Neighborhood Build
Bought by
Susan W Poole
Purchase Details
Closed on
Dec 4, 2003
Sold by
Charles Johnson
Bought by
Traditional Neighborhood Build
Purchase Details
Closed on
Mar 1, 1996
Bought by
Charles Johnson
Create a Home Valuation Report for This Property
The Home Valuation Report is an in-depth analysis detailing your home's value as well as a comparison with similar homes in the area
Purchase History
| Date | Buyer | Sale Price | Title Company |
|---|---|---|---|
| Brooks Gregory A | $140,000 | -- | |
| Chandler Danny J | $182,500 | -- | |
| Chandler Danny J | $182,500 | -- | |
| Susan W Poole | $169,000 | -- | |
| Traditional Neighborhood Build | $34,000 | -- | |
| Charles Johnson | -- | -- |
Source: Public Records
Mortgage History
| Date | Status | Borrower | Loan Amount |
|---|---|---|---|
| Open | Brooks Gregory A | $143,010 | |
| Previous Owner | Chandler Danny J | $138,000 |
Source: Public Records
Tax History
| Year | Tax Paid | Tax Assessment Tax Assessment Total Assessment is a certain percentage of the fair market value that is determined by local assessors to be the total taxable value of land and additions on the property. | Land | Improvement |
|---|---|---|---|---|
| 2025 | $3,075 | $120,928 | $21,000 | $99,928 |
| 2024 | $2,768 | $103,480 | $21,000 | $82,480 |
| 2023 | $2,756 | $103,040 | $21,000 | $82,040 |
| 2022 | $2,299 | $84,372 | $15,000 | $69,372 |
| 2021 | $2,267 | $77,160 | $12,000 | $65,160 |
| 2020 | $2,267 | $77,160 | $12,000 | $65,160 |
| 2019 | $2,066 | $70,480 | $10,000 | $60,480 |
| 2018 | $2,072 | $70,692 | $10,000 | $60,692 |
| 2017 | $2,072 | $70,692 | $10,000 | $60,692 |
| 2016 | $2,018 | $68,907 | $10,000 | $58,907 |
| 2015 | $2,022 | $68,907 | $10,000 | $58,907 |
| 2014 | $1,848 | $63,038 | $8,400 | $54,638 |
| 2013 | -- | $62,627 | $8,400 | $54,227 |
Source: Public Records
Map
Nearby Homes
- 300 Old Pond Rd
- 124 Woodridge Cir
- 105 Ridgefield Dr
- 112 Celebration Blvd
- 793 Celebration Blvd
- 509 Youngs Mill Rd
- 129 Celebration Blvd
- 200 Crestwood Dr
- 119 Sir Lancelot St
- 517 Tradition Place
- 519 Tradition Place
- 109 Sarah Ln
- 101 Sarah Ln
- 227 River Meadow Dr
- 412 Sweetwood Ct Unit A36
- 304 Bridgette Blvd
- 107 N Barnard Ave
- 789 Hammett Rd
- 0 N Barnard Ave
- 883 Hammett Rd
- 235 Old Pond Rd
- 308 Old Pond Rd
- 306 Old Pond Rd
- 304 Old Pond Rd
- 233 Old Pond Rd
- 310 Old Pond Rd
- 217 Old Pond Rd
- 239 Old Pond Rd
- 239 Old Pond Rd Unit N
- 302 Old Pond Rd
- 312 Old Pond Rd
- 231 Old Pond Rd
- 241 Old Pond Rd
- 219 Old Pond Rd
- 314 Old Pond Rd
- 213 Old Pond Rd
- 258 Old Pond Rd
- 229 Old Pond Rd
- 243 Old Pond Rd
- 316 Old Pond Rd
Your Personal Tour Guide
Ask me questions while you tour the home.