237 Orchard St Marion, OH 43302
Estimated Value: $110,000
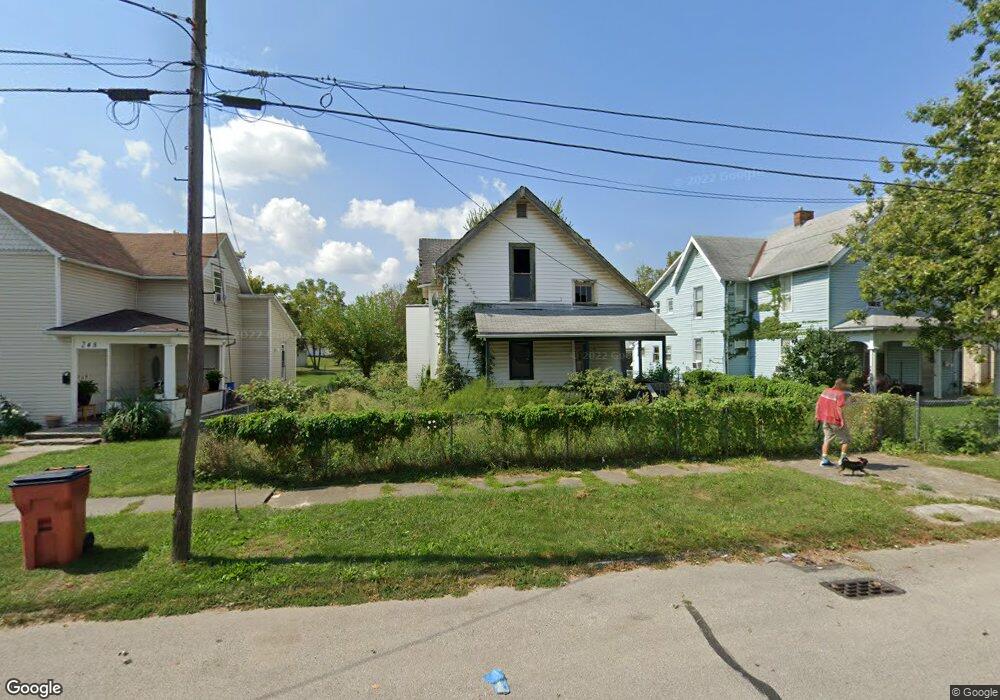
About This Home
This home is located at 237 Orchard St, Marion, OH 43302 and is currently priced at $110,000, approximately $86 per square foot. 237 Orchard St is a home located in Marion County with nearby schools including James A. Garfield Elementary School, Ulysses S. Grant Middle School, and Harding High School.
Ownership History
We collect this data history from publicly available records. To have your information removed, we recommend requesting removal directly through your county’s website.
Purchase Details
Purchase Details
Home Values in the Area
Average Home Value in this Area
Purchase History
We collect this data history from publicly available records. To have your information removed, we recommend requesting removal directly through your county’s website.
| Date | Buyer | Sale Price | Title Company |
|---|---|---|---|
| -- | None Listed On Document | ||
| $11,500 | -- |
Tax History
We collect this data history from publicly available records. To have your information removed, we recommend requesting removal directly through your county’s website.
| Year | Tax Paid | Tax Assessment Tax Assessment Total Assessment is a certain percentage of the fair market value that is determined by local assessors to be the total taxable value of land and additions on the property. | Land | Improvement |
|---|---|---|---|---|
| 2025 | $426 | $8,080 | $2,510 | $5,570 |
| 2024 | $426 | $11,080 | $2,410 | $8,670 |
| 2023 | $426 | $11,130 | $2,460 | $8,670 |
| 2022 | $1,166 | $11,130 | $2,460 | $8,670 |
| 2021 | $625 | $9,080 | $2,140 | $6,940 |
| 2020 | $823 | $9,080 | $2,140 | $6,940 |
| 2019 | $361 | $9,080 | $2,140 | $6,940 |
| 2018 | $465 | $11,710 | $2,100 | $9,610 |
| 2017 | $519 | $11,710 | $2,100 | $9,610 |
| 2016 | $115 | $11,710 | $2,100 | $9,610 |
| 2015 | $116 | $11,680 | $2,010 | $9,670 |
| 2014 | $418 | $11,680 | $2,010 | $9,670 |
| 2012 | $268 | $15,460 | $2,340 | $13,120 |
Map
- 229 W Columbia St
- 302 Blaine Ave
- 368 Windsor St
- 429 W Columbia St
- 187 Olney Ave
- 408 Pearl St Unit 410
- 447 Windsor St
- 138 Park Blvd
- 376 Park Blvd
- 276 S State St
- 489 S Prospect St
- 342 Owens St
- 126 W Washington Ave
- 562 Wood St
- 563 Wood St
- 211 Saint James St
- 343 Commercial St
- 638 Windsor St
- 519 Mound St
- 626 Irey Ave
- 231 Orchard St
- 245 Orchard St
- 251 Orchard St
- 225 Orchard St
- 259 Orchard St
- 217 Orchard St
- 254 Orchard St
- 217 Orchard St
- 260 Orchard St
- 211 Orchard St
- 266 Orchard St
- 257 W Pleasant St
- 271 Orchard St
- 248 W Pleasant St
- 251 W Pleasant St
- 270 Orchard St
- 205 Orchard St
- 270 Orchard St
- 257 W Pleasant (P)
- 244 Windsor St
Ask me questions while you tour the home.