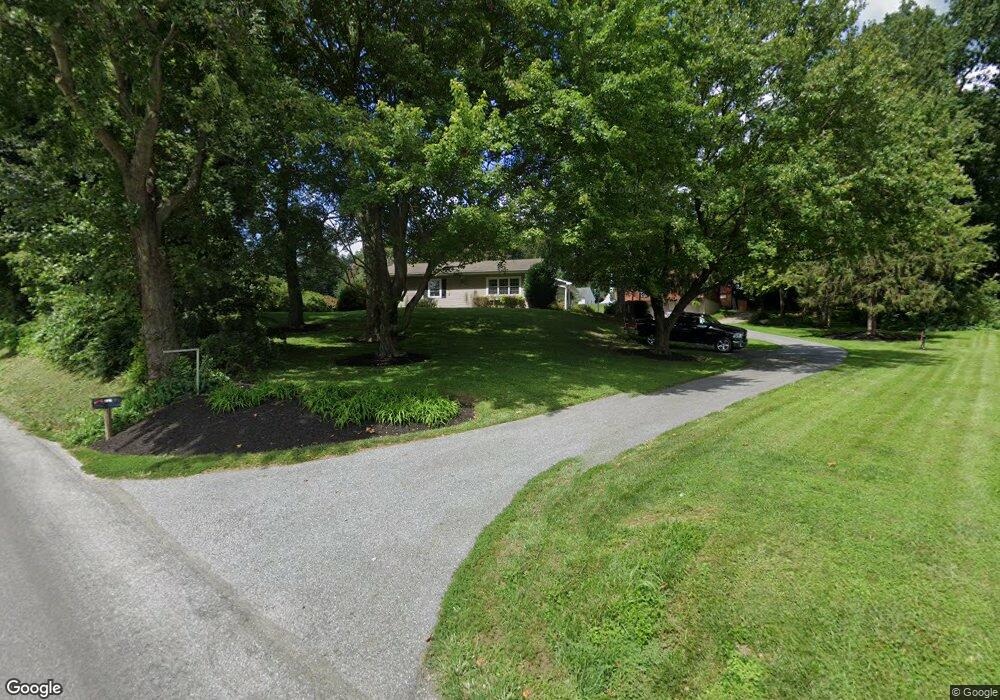
237 Pennsy Rd New Providence, PA 17560
Estimated Value: $322,000 - $390,623
3
Beds
2
Baths
1,784
Sq Ft
$192/Sq Ft
Est. Value
About This Home
This home is located at 237 Pennsy Rd, New Providence, PA 17560 and is currently estimated at $342,656, approximately $192 per square foot. 237 Pennsy Rd is a home located in Lancaster County with nearby schools including Smith Middle School and Solanco High School.
Ownership History
Date
Name
Owned For
Owner Type
Purchase Details
Closed on
May 31, 2011
Sold by
Murry Jeremiah S
Bought by
Murry Jeremiah S and Murry Heather L
Current Estimated Value
Home Financials for this Owner
Home Financials are based on the most recent Mortgage that was taken out on this home.
Original Mortgage
$130,000
Outstanding Balance
$50,925
Interest Rate
4.85%
Mortgage Type
New Conventional
Estimated Equity
$291,731
Purchase Details
Closed on
Sep 20, 2002
Sold by
Murry Rayond D and Murry Sandra E
Bought by
Murry Jeremiah S
Home Financials for this Owner
Home Financials are based on the most recent Mortgage that was taken out on this home.
Original Mortgage
$92,800
Interest Rate
6.27%
Purchase Details
Closed on
May 17, 2002
Sold by
Falk Iva Jane
Bought by
Murry Raymond D and Murry Sandra E
Purchase Details
Closed on
May 17, 2001
Sold by
Falk Iva Jane
Bought by
Falk Iva Jane
Create a Home Valuation Report for This Property
The Home Valuation Report is an in-depth analysis detailing your home's value as well as a comparison with similar homes in the area
Home Values in the Area
Average Home Value in this Area
Purchase History
| Date | Buyer | Sale Price | Title Company |
|---|---|---|---|
| Murry Jeremiah S | -- | None Available | |
| Murry Jeremiah S | -- | Fidelity National Title Ins | |
| Murry Raymond D | $75,000 | -- | |
| Falk Iva Jane | -- | -- | |
| Falk Iva Jane | -- | -- | |
| Falk Iva Jane | -- | -- |
Source: Public Records
Mortgage History
| Date | Status | Borrower | Loan Amount |
|---|---|---|---|
| Open | Murry Jeremiah S | $130,000 | |
| Closed | Murry Jeremiah S | $92,800 |
Source: Public Records
Tax History Compared to Growth
Tax History
| Year | Tax Paid | Tax Assessment Tax Assessment Total Assessment is a certain percentage of the fair market value that is determined by local assessors to be the total taxable value of land and additions on the property. | Land | Improvement |
|---|---|---|---|---|
| 2025 | $3,285 | $211,100 | $85,400 | $125,700 |
| 2024 | $3,285 | $211,100 | $85,400 | $125,700 |
| 2023 | $3,185 | $211,100 | $85,400 | $125,700 |
| 2022 | $3,090 | $211,100 | $85,400 | $125,700 |
| 2021 | $2,980 | $211,100 | $85,400 | $125,700 |
| 2020 | $2,980 | $211,100 | $85,400 | $125,700 |
| 2019 | $2,903 | $211,100 | $85,400 | $125,700 |
| 2018 | $695 | $211,100 | $85,400 | $125,700 |
| 2017 | $3,003 | $178,600 | $43,000 | $135,600 |
| 2016 | $3,035 | $178,600 | $43,000 | $135,600 |
| 2015 | $811 | $178,600 | $43,000 | $135,600 |
| 2014 | $2,036 | $178,600 | $43,000 | $135,600 |
Source: Public Records
Map
Nearby Homes
- 17 Ashton Dr
- 1619 Beaver Valley Pike
- 11 Cinder Rd
- 1592 White Oak Rd
- 309 Poplar Ln
- 8 Forest Ln
- 1858 White Oak Rd
- 0 Mount Hope School Rd
- 3 Woods Dr
- 4 Ponderosa Ln
- 3 Ponderosa Ln
- 2074 White Oak Rd
- 40 Kimberly Ave
- 556 Holly Dr
- 430 Cinder Rd
- 594 Truce Rd
- 409 Hilltop Rd
- 574 Cinder Rd
- 191 Sigman Rd
- 264 Mount Hope School Rd
- 243 Pennsy Rd
- 241 Pennsy Rd
- 247 Pennsy Rd
- 213 Pennsy Rd
- 280 Pennsy Rd
- 186 Pennsy Rd
- 183 Pennsy Rd
- 299 Pennsy Rd
- 6 Hollow Rd
- 26 Hollow Rd
- 1736 Beaver Valley Pike
- 124 Pennsy Rd
- 82 Krantz Mill Rd
- 177 Refton Rd
- 38 Krantz Mill Rd
- 29 Krantz Mill Rd
- 112 Pennsy Rd
- 13 Krantz Mill Rd
- 161 Refton Rd
- 115 Hollow Rd