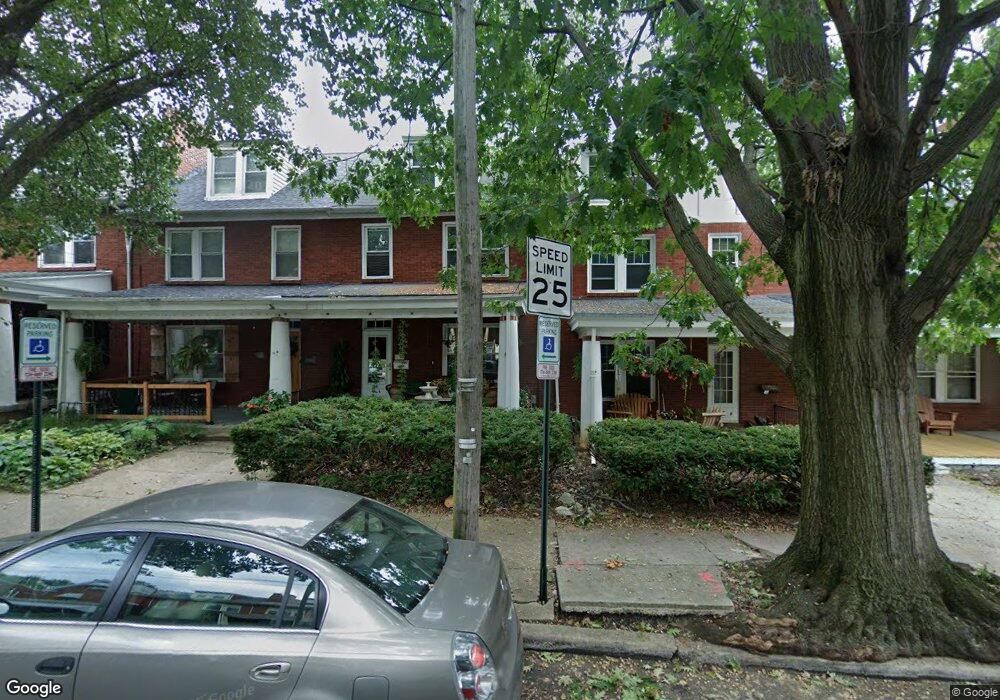
237 Ruby St Lancaster, PA 17603
West End NeighborhoodEstimated Value: $204,000 - $267,000
3
Beds
1
Bath
1,450
Sq Ft
$168/Sq Ft
Est. Value
About This Home
This home is located at 237 Ruby St, Lancaster, PA 17603 and is currently estimated at $243,246, approximately $167 per square foot. 237 Ruby St is a home located in Lancaster County with nearby schools including Smith-Wade-El Elementary School, Wheatland Middle School, and McCaskey High School.
Ownership History
Date
Name
Owned For
Owner Type
Purchase Details
Closed on
Apr 1, 2011
Sold by
Secretary Of Housing & Urban Development
Bought by
Erb Mark P
Current Estimated Value
Purchase Details
Closed on
Sep 28, 2000
Sold by
Culp Donald R
Bought by
Erb Mark P
Home Financials for this Owner
Home Financials are based on the most recent Mortgage that was taken out on this home.
Original Mortgage
$69,939
Interest Rate
7.94%
Mortgage Type
FHA
Purchase Details
Closed on
Jan 27, 2000
Sold by
Culp Donald R and Culp Karen W
Bought by
Culp Donald R
Create a Home Valuation Report for This Property
The Home Valuation Report is an in-depth analysis detailing your home's value as well as a comparison with similar homes in the area
Home Values in the Area
Average Home Value in this Area
Purchase History
| Date | Buyer | Sale Price | Title Company |
|---|---|---|---|
| Erb Mark P | $48,100 | None Available | |
| Erb Mark P | $70,000 | -- | |
| Culp Donald R | -- | -- |
Source: Public Records
Mortgage History
| Date | Status | Borrower | Loan Amount |
|---|---|---|---|
| Previous Owner | Erb Mark P | $69,939 |
Source: Public Records
Tax History
| Year | Tax Paid | Tax Assessment Tax Assessment Total Assessment is a certain percentage of the fair market value that is determined by local assessors to be the total taxable value of land and additions on the property. | Land | Improvement |
|---|---|---|---|---|
| 2025 | $3,921 | $99,100 | $23,300 | $75,800 |
| 2024 | $3,921 | $99,100 | $23,300 | $75,800 |
| 2023 | $3,855 | $99,100 | $23,300 | $75,800 |
| 2022 | $3,695 | $99,100 | $23,300 | $75,800 |
| 2021 | $3,616 | $99,100 | $23,300 | $75,800 |
| 2020 | $3,616 | $99,100 | $23,300 | $75,800 |
| 2019 | $3,562 | $99,100 | $23,300 | $75,800 |
| 2018 | $1,677 | $99,100 | $23,300 | $75,800 |
| 2017 | $3,670 | $79,900 | $16,200 | $63,700 |
| 2016 | $3,636 | $79,900 | $16,200 | $63,700 |
| 2015 | $1,419 | $79,900 | $16,200 | $63,700 |
| 2014 | $2,746 | $79,900 | $16,200 | $63,700 |
Source: Public Records
Map
Nearby Homes
Your Personal Tour Guide
Ask me questions while you tour the home.