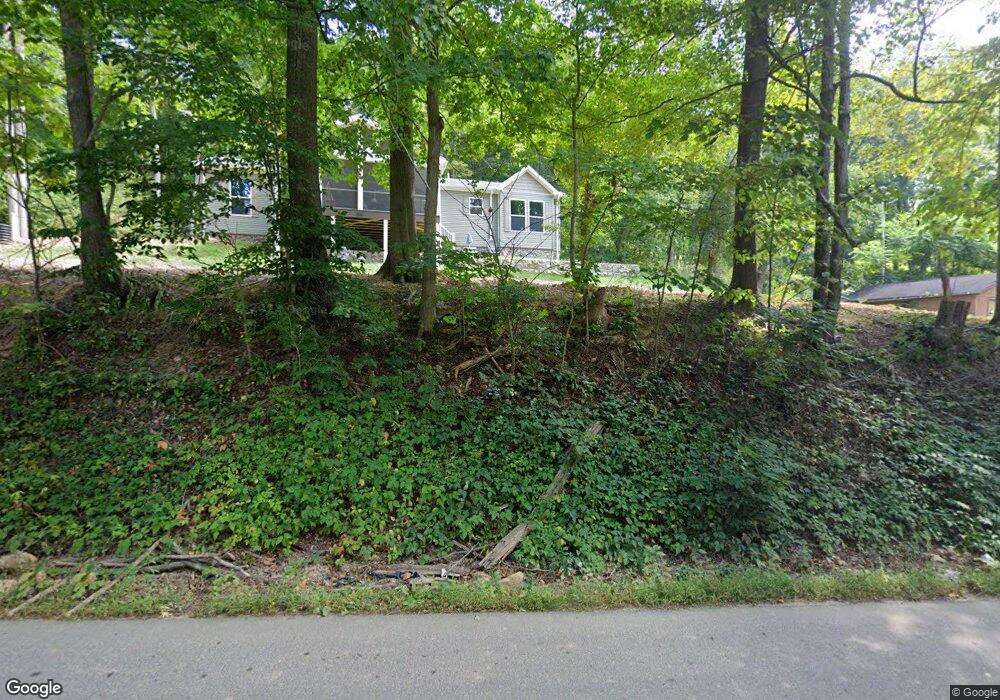
237 Statler Run Rd Fairview, WV 26570
Estimated Value: $150,000 - $245,604
3
Beds
2
Baths
1,718
Sq Ft
$123/Sq Ft
Est. Value
About This Home
This home is located at 237 Statler Run Rd, Fairview, WV 26570 and is currently estimated at $210,901, approximately $122 per square foot. 237 Statler Run Rd is a home located in Monongalia County with nearby schools including Mason-Dixon Elementary School and Clay-Battelle Middle/High School.
Ownership History
Date
Name
Owned For
Owner Type
Purchase Details
Closed on
Sep 15, 2023
Sold by
Garrett Zackary D and Garrett Tricia L
Bought by
Garrett Zackary D and Garrett Tricia L
Current Estimated Value
Purchase Details
Closed on
May 13, 2020
Sold by
Mcclure Dayna B and Brewer Craig S
Bought by
Brewer Craig S
Purchase Details
Closed on
Aug 4, 2009
Sold by
Rucker Ingeborg F
Bought by
Pregley Chad Anthony
Home Financials for this Owner
Home Financials are based on the most recent Mortgage that was taken out on this home.
Original Mortgage
$41,300
Interest Rate
5.19%
Mortgage Type
Credit Line Revolving
Create a Home Valuation Report for This Property
The Home Valuation Report is an in-depth analysis detailing your home's value as well as a comparison with similar homes in the area
Purchase History
We collect this data history from publicly available records. To have your information removed, we recommend requesting removal directly through your county’s website.
| Date | Buyer | Sale Price | Title Company |
|---|---|---|---|
| Garrett Zackary D | -- | None Listed On Document | |
| Garrett Zackary D | -- | None Listed On Document | |
| Brewer Craig S | -- | None Available | |
| Pregley Chad Anthony | $55,000 | None Available |
Source: Public Records
Mortgage History
We collect this data history from publicly available records. To have your information removed, we recommend requesting removal directly through your county’s website.
| Date | Status | Borrower | Loan Amount |
|---|---|---|---|
| Previous Owner | Pregley Chad Anthony | $41,300 |
Source: Public Records
Tax History
| Year | Tax Paid | Tax Assessment Tax Assessment Total Assessment is a certain percentage of the fair market value that is determined by local assessors to be the total taxable value of land and additions on the property. | Land | Improvement |
|---|---|---|---|---|
| 2025 | $937 | $87,720 | $17,100 | $70,620 |
| 2024 | $937 | $89,220 | $17,100 | $72,120 |
| 2023 | $951 | $89,220 | $17,100 | $72,120 |
| 2022 | $131 | $12,780 | $8,400 | $4,380 |
| 2021 | $132 | $12,780 | $8,400 | $4,380 |
| 2020 | $587 | $56,760 | $17,100 | $39,660 |
| 2019 | $498 | $47,820 | $17,100 | $30,720 |
| 2018 | $506 | $48,420 | $17,100 | $31,320 |
| 2017 | $499 | $47,520 | $16,200 | $31,320 |
| 2016 | $572 | $54,060 | $16,200 | $37,860 |
| 2015 | $533 | $52,740 | $14,880 | $37,860 |
| 2014 | $503 | $52,200 | $14,280 | $37,920 |
Source: Public Records
Map
Nearby Homes
- 271 Statler Run Rd
- TBD Behlar Rd
- 1637 Daybrook Rd
- 102 Indian Run Rd
- 245 Days Run Rd
- Rd Unit Lot WP001
- 1208 Hagans Rd
- 147 Craig Run Rd
- TBD Rush Run Rd
- TBD Fawn Meadow Dr
- 79 Punkin Center Rd
- 108 Caddie Ct
- 104 Caddie Ct
- TBD Daybrook Rd
- 132 Eagle Dr
- 104 Eagle Dr
- 322 Wilson Rd
- 403 Oakmont Ct
- 426 Oakmont Ct
- 494 Watson Dr
- 243 Statler Run Rd
- 279 Statler Run Rd
- 32 Country Rd
- 66 Country Rd
- 43 Country Rd
- 31 Country Rd
- 71 Country Rd
- 70 Country Rd
- 342 Statler Run Rd
- 343 Statler Run Rd
- 343 Statler Run Rd
- 356 Statler Run Rd
- 331 Statler Run Rd
- 355 Statler Run Rd
- 362 Statler Run Rd
- 327 Statler Run Rd
- 85 Country Rd
- 39 Ellis Tennant Hollow
- 74 Statler Run Rd
- 45 Statler Run Rd
Your Personal Tour Guide
Ask me questions while you tour the home.