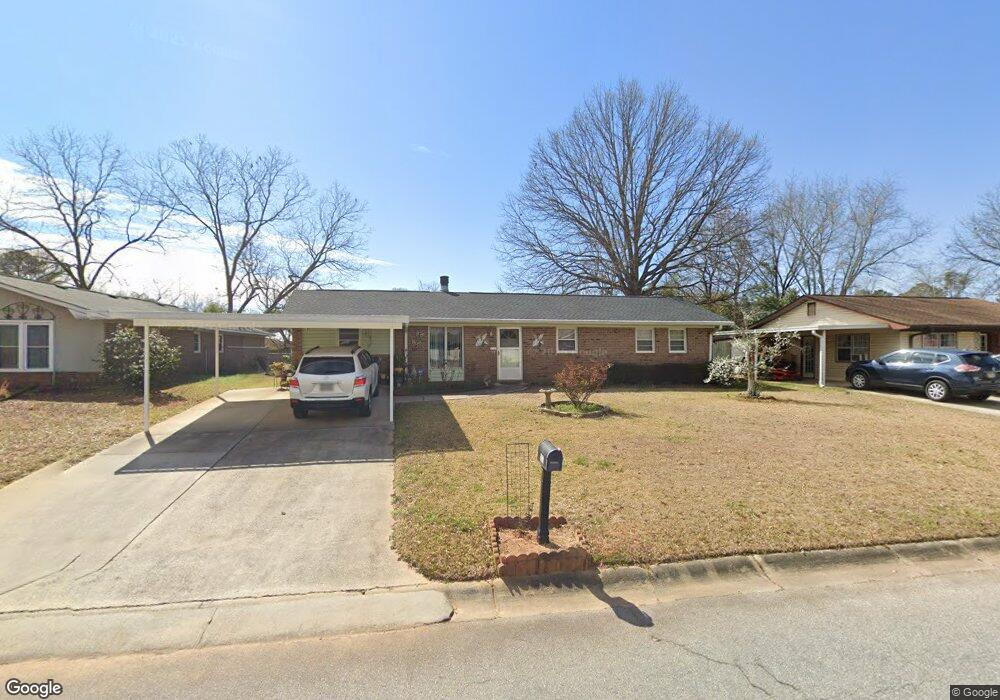
237 Valencia Cir Centerville, GA 31028
Estimated Value: $167,754 - $192,000
3
Beds
2
Baths
1,400
Sq Ft
$130/Sq Ft
Est. Value
About This Home
This home is located at 237 Valencia Cir, Centerville, GA 31028 and is currently estimated at $182,439, approximately $130 per square foot. 237 Valencia Cir is a home located in Houston County with nearby schools including Centerville Elementary School, Northside Middle School, and Northside High School.
Ownership History
Date
Name
Owned For
Owner Type
Purchase Details
Closed on
Jun 23, 1994
Sold by
Bauman Nonglak and Bauman Larry
Bought by
Baumann Nonglak and Baumann Lawrence
Current Estimated Value
Purchase Details
Closed on
Sep 1, 1993
Sold by
Ritch Nonglak
Bought by
Bauman Nonglak and Bauman Larry
Purchase Details
Closed on
Mar 1, 1990
Sold by
Ritch Billy C and Ritch Nonglak
Bought by
Ritch Nonglak
Purchase Details
Closed on
Nov 11, 1982
Sold by
Dubberly Betty P
Bought by
Ritch Billy C and Ritch Nonglak
Purchase Details
Closed on
Mar 28, 1975
Sold by
Burris Kenneth A and Burris Dorinda C
Bought by
Dubberly Betty P
Purchase Details
Closed on
Jun 30, 1972
Sold by
Selph Const & Dev Co Inc
Bought by
Burris Kenneth A and Burris Dorinda C
Purchase Details
Closed on
Apr 9, 1971
Sold by
Grove Frances B
Bought by
Selph Const & Dev Co Inc
Create a Home Valuation Report for This Property
The Home Valuation Report is an in-depth analysis detailing your home's value as well as a comparison with similar homes in the area
Home Values in the Area
Average Home Value in this Area
Purchase History
| Date | Buyer | Sale Price | Title Company |
|---|---|---|---|
| Baumann Nonglak | -- | -- | |
| Bauman Nonglak | -- | -- | |
| Ritch Nonglak | -- | -- | |
| Ritch Billy C | -- | -- | |
| Dubberly Betty P | -- | -- | |
| Burris Kenneth A | -- | -- | |
| Selph Const & Dev Co Inc | $23,000 | -- |
Source: Public Records
Tax History
| Year | Tax Paid | Tax Assessment Tax Assessment Total Assessment is a certain percentage of the fair market value that is determined by local assessors to be the total taxable value of land and additions on the property. | Land | Improvement |
|---|---|---|---|---|
| 2025 | $1,462 | $57,760 | $8,000 | $49,760 |
| 2024 | $1,730 | $55,880 | $8,000 | $47,880 |
| 2023 | $1,414 | $46,480 | $8,000 | $38,480 |
| 2022 | $605 | $35,480 | $7,200 | $28,280 |
| 2021 | $467 | $29,320 | $5,400 | $23,920 |
| 2020 | $1,034 | $29,320 | $5,400 | $23,920 |
| 2019 | $469 | $29,320 | $5,400 | $23,920 |
| 2018 | $469 | $29,320 | $5,400 | $23,920 |
| 2017 | $469 | $29,320 | $5,400 | $23,920 |
| 2016 | $470 | $29,320 | $5,400 | $23,920 |
| 2015 | $470 | $29,320 | $5,400 | $23,920 |
| 2014 | -- | $28,200 | $5,400 | $22,800 |
| 2013 | -- | $29,680 | $5,400 | $24,280 |
Source: Public Records
Map
Nearby Homes
- 218 Valencia Cir
- 136 Scarborough Rd
- 106 Scarborough Rd
- 102 Pine Glen Ct
- 202 Magnolia Glen
- 312 Hickory Glen
- 106 Maple Glen Ct
- 105 Maple Glen Ct
- 156 Martin Mill Trail
- 110 Stonefield Ct
- 201 Eagles Landing Trail
- 110 Wray St
- 208 Pellimore Dr
- 414 Forest Lake Dr
- 117 Crestwood Ct
- 94 Tiffany Ln
- 857 Ola Dr
- 121 Crestwood Rd
- 108 Weaver Rd
- 118 Avalon Dr
- 239 Valencia Cir
- 235 Valencia Cir
- 201 Montiego Ct
- 241 Valencia Cir
- 233 Valencia Cir
- 103 Montiego Ct
- 103 Monteigo Ct
- 246 Valencia Cir
- 203 Montiego Ct
- 244 Valencia Cir
- 248 Valencia Cir
- 105 Montiego Ct
- 105 Monteigo Ct
- 243 Valencia Cir
- 250 Valencia Cir
- 205 Monteigo Ct
- 242 Valencia Cir
- 231 Valencia Cir
- 205 Montiego Ct
- 107 Montiego Ct
Your Personal Tour Guide
Ask me questions while you tour the home.