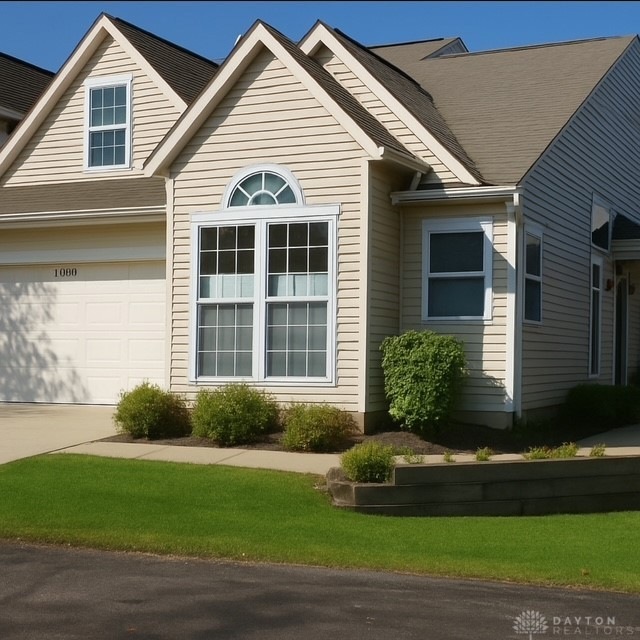
2370 Donamere Cir Unit 9C Dayton, OH 45459
Estimated payment $2,166/month
Highlights
- 1 Fireplace
- 2 Car Attached Garage
- Forced Air Heating and Cooling System
- Primary Village North Rated A
- Bathroom on Main Level
About This Home
Absolutely beautiful and updated 3 bedroom, 2.5 bath condo with loft space. Backs up to green space. Enjoy tranquil, low maintenance living!
Property Details
Home Type
- Condominium
Est. Annual Taxes
- $3,885
Year Built
- 1996
HOA Fees
- $295 Monthly HOA Fees
Parking
- 2 Car Attached Garage
Home Design
- Brick Exterior Construction
- Slab Foundation
- Frame Construction
Interior Spaces
- 1,711 Sq Ft Home
- 1.5-Story Property
- 1 Fireplace
Kitchen
- Range
- Microwave
- Dishwasher
Bedrooms and Bathrooms
- 3 Bedrooms
- Bathroom on Main Level
Utilities
- Forced Air Heating and Cooling System
- Heating System Uses Natural Gas
Community Details
- Springbrooke Condo Ph I Subdivision
Listing and Financial Details
- Assessor Parcel Number O68-51206-0004
Map
Home Values in the Area
Average Home Value in this Area
Tax History
| Year | Tax Paid | Tax Assessment Tax Assessment Total Assessment is a certain percentage of the fair market value that is determined by local assessors to be the total taxable value of land and additions on the property. | Land | Improvement |
|---|---|---|---|---|
| 2024 | $3,885 | $75,960 | $13,850 | $62,110 |
| 2023 | $3,885 | $75,960 | $13,850 | $62,110 |
| 2022 | $3,331 | $54,130 | $9,890 | $44,240 |
| 2021 | $3,340 | $54,130 | $9,890 | $44,240 |
| 2020 | $3,335 | $54,130 | $9,890 | $44,240 |
| 2019 | $3,402 | $50,070 | $9,890 | $40,180 |
| 2018 | $3,016 | $50,070 | $9,890 | $40,180 |
| 2017 | $2,981 | $50,070 | $9,890 | $40,180 |
| 2016 | $2,531 | $41,820 | $9,890 | $31,930 |
| 2015 | $2,506 | $41,820 | $9,890 | $31,930 |
| 2014 | $2,506 | $41,820 | $9,890 | $31,930 |
| 2012 | -- | $43,010 | $9,890 | $33,120 |
Property History
| Date | Event | Price | List to Sale | Price per Sq Ft |
|---|---|---|---|---|
| 12/01/2025 12/01/25 | Pending | -- | -- | -- |
| 12/01/2025 12/01/25 | For Sale | $295,000 | -- | $172 / Sq Ft |
Purchase History
| Date | Type | Sale Price | Title Company |
|---|---|---|---|
| Warranty Deed | $140,000 | Attorney | |
| Land Contract | $140,000 | None Available | |
| Warranty Deed | $158,000 | -- |
Mortgage History
| Date | Status | Loan Amount | Loan Type |
|---|---|---|---|
| Open | $100,000 | Adjustable Rate Mortgage/ARM | |
| Previous Owner | $100,000 | Seller Take Back | |
| Previous Owner | $126,400 | No Value Available |
Source: Dayton REALTORS®
MLS Number: 948581
APN: O68-51206-0004
Disclaimer: Certain information contained herein is derived from information provided by parties other than Homes.com. All information provided is deemed reliable, but is not guaranteed to be accurate and should be independently verified.
![]() The information is being provided by Dayton Area Board of Realtors MLS. Information deemed reliable but not guaranteed. Information is provided for the consumer's personal, non-commercial use, and may not be used for any purpose other than the identification of potential properties for purchase. Copyright 2025 Dayton Area Board of Realtors MLS. All Rights Reserved.
The information is being provided by Dayton Area Board of Realtors MLS. Information deemed reliable but not guaranteed. Information is provided for the consumer's personal, non-commercial use, and may not be used for any purpose other than the identification of potential properties for purchase. Copyright 2025 Dayton Area Board of Realtors MLS. All Rights Reserved.
- 7201 Brookmeadow Dr Unit 11A
- 2349 Donamere Cir Unit 5C
- 7602 Pelbrook Farm Dr
- 7622 Pelbrook Farm Dr
- 2580 Hingham Ln
- 2585 Hingham Ln
- 6780 Montpellier Blvd
- 2565 Briggs Rd
- 2193 Tampico Trail
- 1563 Langdon Dr
- 1594 Mapleton Dr
- 1953 Baldwin Dr
- 4353 Napa Valley Dr
- 4342 Napa Valley Dr
- 1973 Home Path Ct
- 6331 Adams Cir Unit 16
- 6694 Wareham Ct
- 6625 Hedington Square
- 6374 Adams Cir Unit 24
- 6650 Wareham Ct Unit 5
