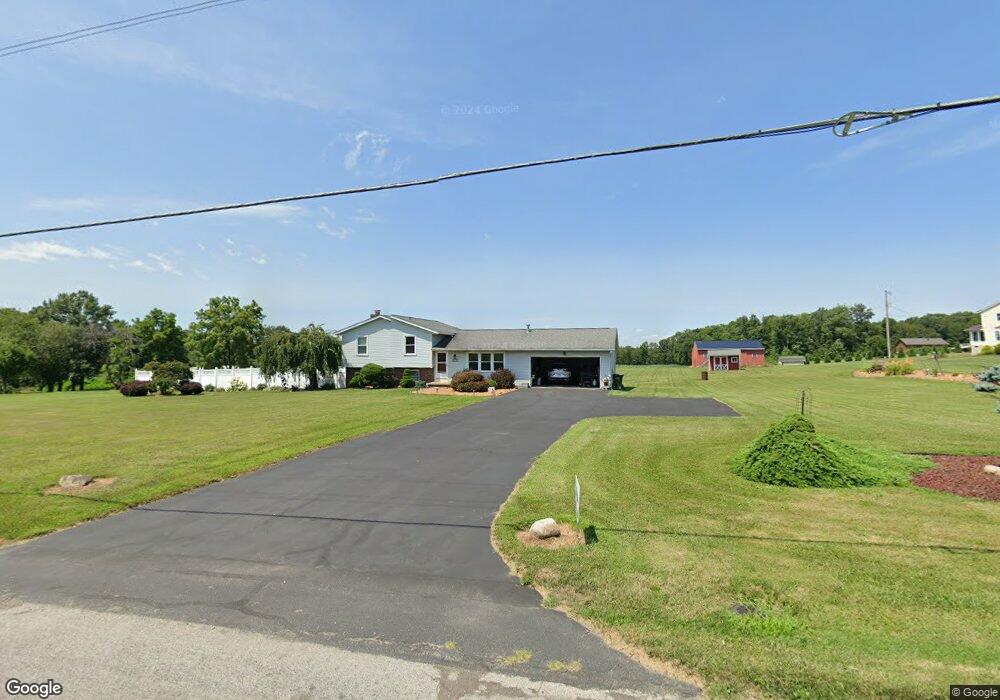
2370 E Messner Rd Wooster, OH 44691
Estimated Value: $296,000 - $399,000
3
Beds
1
Bath
1,232
Sq Ft
$267/Sq Ft
Est. Value
About This Home
This home is located at 2370 E Messner Rd, Wooster, OH 44691 and is currently estimated at $329,337, approximately $267 per square foot. 2370 E Messner Rd is a home located in Wayne County with nearby schools including Triway High School, Sunny Meadow, and Spring Hill.
Ownership History
Date
Name
Owned For
Owner Type
Purchase Details
Closed on
Dec 22, 2016
Sold by
Jones Earl W
Bought by
Jones Deborah L
Current Estimated Value
Home Financials for this Owner
Home Financials are based on the most recent Mortgage that was taken out on this home.
Original Mortgage
$50,000
Outstanding Balance
$4,512
Interest Rate
4.16%
Mortgage Type
New Conventional
Estimated Equity
$324,825
Purchase Details
Closed on
Jun 28, 2004
Sold by
Jones Earl W and Jones Deborah L
Bought by
Jones Earl W and Jones Deborah L
Home Financials for this Owner
Home Financials are based on the most recent Mortgage that was taken out on this home.
Original Mortgage
$50,000
Interest Rate
6.37%
Mortgage Type
New Conventional
Purchase Details
Closed on
Feb 3, 1992
Sold by
Carter Charles R and Carter Joni D
Bought by
Jones Earl W and Jones Deborah
Create a Home Valuation Report for This Property
The Home Valuation Report is an in-depth analysis detailing your home's value as well as a comparison with similar homes in the area
Purchase History
| Date | Buyer | Sale Price | Title Company |
|---|---|---|---|
| Jones Deborah L | -- | Southern Title | |
| Jones Earl W | -- | -- | |
| Jones Earl W | $11,000 | -- |
Source: Public Records
Mortgage History
| Date | Status | Borrower | Loan Amount |
|---|---|---|---|
| Open | Jones Deborah L | $50,000 | |
| Closed | Jones Earl W | $50,000 |
Source: Public Records
Tax History
| Year | Tax Paid | Tax Assessment Tax Assessment Total Assessment is a certain percentage of the fair market value that is determined by local assessors to be the total taxable value of land and additions on the property. | Land | Improvement |
|---|---|---|---|---|
| 2025 | $3,273 | $95,290 | $21,850 | $73,440 |
| 2024 | $3,273 | $95,290 | $21,850 | $73,440 |
| 2023 | $3,298 | $95,290 | $21,850 | $73,440 |
| 2022 | $2,466 | $65,260 | $14,960 | $50,300 |
| 2021 | $2,471 | $65,260 | $14,960 | $50,300 |
| 2020 | $2,500 | $65,260 | $14,960 | $50,300 |
| 2019 | $2,455 | $62,220 | $14,110 | $48,110 |
| 2018 | $2,499 | $62,220 | $14,110 | $48,110 |
| 2017 | $2,489 | $62,220 | $14,110 | $48,110 |
| 2016 | $2,193 | $54,110 | $12,270 | $41,840 |
| 2015 | $2,142 | $54,110 | $12,270 | $41,840 |
| 2014 | $2,145 | $54,110 | $12,270 | $41,840 |
| 2013 | $2,148 | $53,970 | $11,420 | $42,550 |
Source: Public Records
Map
Nearby Homes
- 4348 Buss Rd
- 3419 Fredericksburg Rd
- 8383 Hoy Rd
- 2535 Millersburg Rd
- 3065 Dover Rd
- 9718 James Rd
- 3315 Sylvan Rd
- 2430 S Columbus Rd
- 142 E Clay St
- 115 Cemetery St
- 3299 Crestview Dr
- 140 Ohio St
- 169 Monroe St
- 132 Villard St
- 4859 Prosperity Way
- 0 Heyl Rd
- 219 Mulberry St
- 31 Shannon Dr
- 5 E Melrose Unit 5
- 1225 Barnard Rd
- 2306 E Messner Rd
- 2337 E Messner Rd
- 2402 E Messner Rd
- 5747 Hoy Rd
- 2303 E Messner Rd
- 2454 E Messner Rd
- 2455 E Messner Rd
- 5793 Hoy Rd
- 2500 E Messner Rd
- 5848 Hoy Rd
- 2205 E Messner Rd
- 2226 E Messner Rd
- 2527 E Messner Rd
- 5853 Hoy Rd
- 2166 E Messner Rd
- 2175 E Messner Rd
- 2540 E Messner Rd
- 2555 E Messner Rd
- 5858 Hoy Rd
- 5913 Hoy Rd
Your Personal Tour Guide
Ask me questions while you tour the home.