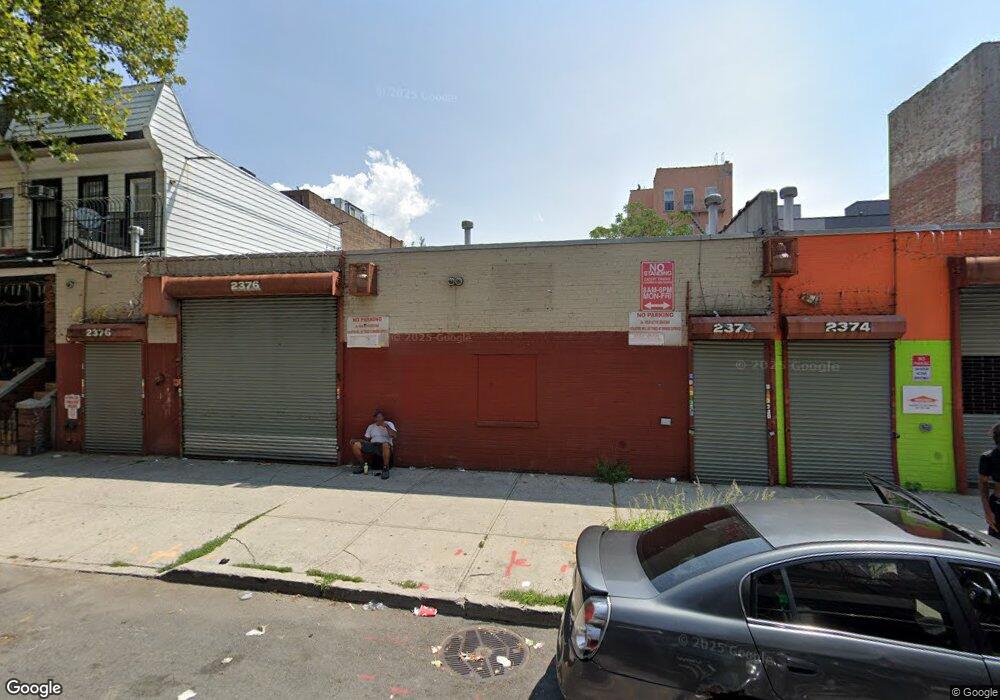
2370 Lorillard Place Bronx, NY 10458
Belmont NeighborhoodEstimated Value: $1,472,075
--
Bed
--
Bath
10,000
Sq Ft
$147/Sq Ft
Est. Value
About This Home
This home is located at 2370 Lorillard Place, Bronx, NY 10458 and is currently estimated at $1,472,075, approximately $147 per square foot. 2370 Lorillard Place is a home located in Bronx County with nearby schools including P.S. 205 Fiorello LaGuardia, Jhs 118 William W Niles, and Children's Aid College Preparatory Charter School.
Ownership History
Date
Name
Owned For
Owner Type
Purchase Details
Closed on
Aug 14, 2012
Sold by
2370 Lorillard Pl Realty Corp
Bought by
Loriplace Realty Management Corporation
Current Estimated Value
Home Financials for this Owner
Home Financials are based on the most recent Mortgage that was taken out on this home.
Original Mortgage
$390,000
Outstanding Balance
$268,900
Interest Rate
3.57%
Mortgage Type
Commercial
Estimated Equity
$1,203,175
Purchase Details
Closed on
Aug 7, 2003
Sold by
2370 Llc
Bought by
2370 Lorillard Place Realty Corp
Home Financials for this Owner
Home Financials are based on the most recent Mortgage that was taken out on this home.
Original Mortgage
$400,000
Interest Rate
5.86%
Mortgage Type
Commercial
Purchase Details
Closed on
Sep 26, 2002
Sold by
Jednak Joseph T
Bought by
23 70 Llc
Create a Home Valuation Report for This Property
The Home Valuation Report is an in-depth analysis detailing your home's value as well as a comparison with similar homes in the area
Home Values in the Area
Average Home Value in this Area
Purchase History
| Date | Buyer | Sale Price | Title Company |
|---|---|---|---|
| Loriplace Realty Management Corporation | $750,000 | -- | |
| 2370 Lorillard Place Realty Corp | $585,000 | -- | |
| 23 70 Llc | -- | -- |
Source: Public Records
Mortgage History
| Date | Status | Borrower | Loan Amount |
|---|---|---|---|
| Open | Loriplace Realty Management Corporation | $390,000 | |
| Previous Owner | 2370 Lorillard Place Realty Corp | $400,000 | |
| Closed | Loriplace Realty Management Corporation | $556,000 |
Source: Public Records
Tax History Compared to Growth
Tax History
| Year | Tax Paid | Tax Assessment Tax Assessment Total Assessment is a certain percentage of the fair market value that is determined by local assessors to be the total taxable value of land and additions on the property. | Land | Improvement |
|---|---|---|---|---|
| 2025 | $33,403 | $314,640 | $90,000 | $224,640 |
| 2024 | $33,403 | $315,360 | $90,000 | $225,360 |
| 2023 | $32,855 | $308,610 | $90,000 | $218,610 |
| 2022 | $29,005 | $300,150 | $90,000 | $210,150 |
| 2021 | $26,997 | $252,450 | $90,000 | $162,450 |
| 2020 | $32,803 | $347,850 | $90,000 | $257,850 |
| 2019 | $31,350 | $305,100 | $90,000 | $215,100 |
| 2018 | $30,905 | $319,050 | $90,000 | $229,050 |
| 2017 | $29,809 | $326,700 | $90,000 | $236,700 |
| 2016 | $27,265 | $257,850 | $90,000 | $167,850 |
| 2015 | $12,321 | $282,150 | $90,000 | $192,150 |
| 2014 | $12,321 | $283,950 | $90,000 | $193,950 |
Source: Public Records
Map
Nearby Homes
- 2301 Bathgate Ave
- 505 E 183rd St
- - - E 183rd Street & Bassford Ave
- 45-44 E 189th St
- 2259 Bassford Ave
- 2255 Bathgate Ave
- 2249 Bassford Ave
- 444 Cyrus Place
- 2314 Cambreleng Ave
- 2447 Beaumont Ave
- 620 E 182nd St
- 2442 Beaumont Ave
- 2439 Crotona Ave
- 2471 Crotona Ave
- 414 E 182nd St
- 2158 Hughes Ave
- 4420 Park Ave
- 4433 Park Ave
- 2304 Prospect Ave
- 2503 Marion Ave
- 2386 Lorillard Place
- 2366 Lorillard Place
- 2388 Lorillard Place
- 2390 Lorillard Place
- 2383 Hoffman St
- 2385 Hoffman St
- 2392 Lorillard Place
- 2387 Hoffman St
- 2387 Hoffman St Unit Building
- 2377 Hoffman St
- 2381 Hoffman St Unit 4
- 2381 Hoffman St
- 2381 Hoffman St Unit 5
- 2381 Hoffman St Unit 1
- 2381 Hoffman St Unit 3
- 2381 Hoffman St Unit 8
- 2394 Lorillard Place
- 2364 Lorillard Place
- 2389 Hoffman St
- 2396 Lorillard Place