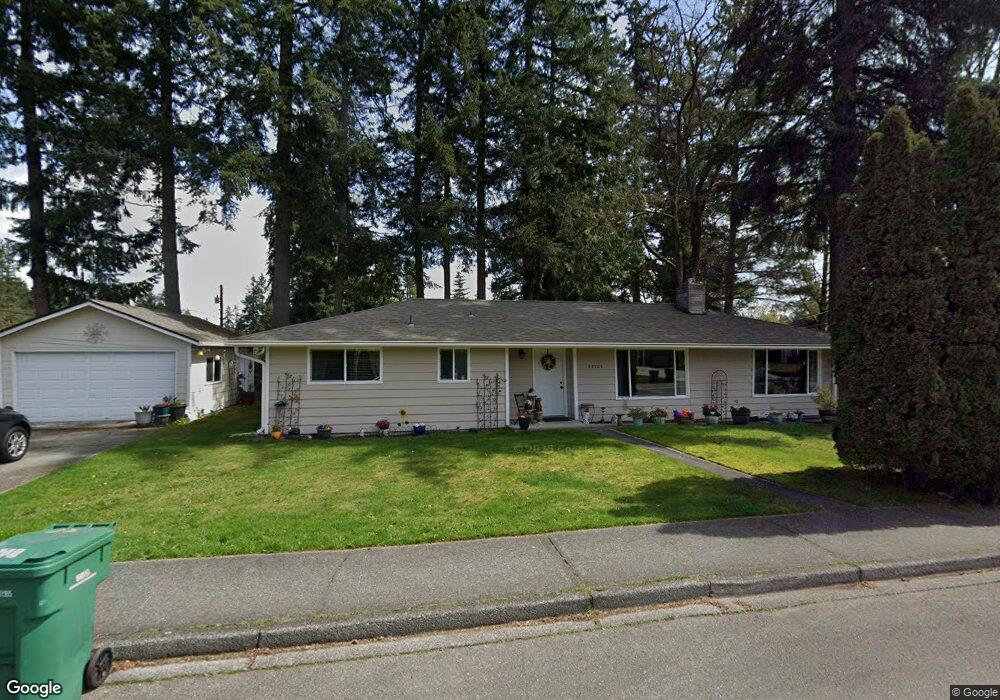
23705 48th Ave W Mountlake Terrace, WA 98043
Gateway NeighborhoodEstimated Value: $725,000 - $770,000
3
Beds
2
Baths
1,265
Sq Ft
$590/Sq Ft
Est. Value
About This Home
This home is located at 23705 48th Ave W, Mountlake Terrace, WA 98043 and is currently estimated at $746,862, approximately $590 per square foot. 23705 48th Ave W is a home located in Snohomish County with nearby schools including Terrace Park Elementary School, Brier Terrace Middle School, and Mountlake Terrace High School.
Ownership History
Date
Name
Owned For
Owner Type
Purchase Details
Closed on
Feb 1, 2023
Sold by
Gordon Merril R
Bought by
Gordon Heidi M
Current Estimated Value
Purchase Details
Closed on
Aug 1, 2006
Sold by
Dmj Properties Llc
Bought by
Gordon Merril R and Gordon Heidi M
Home Financials for this Owner
Home Financials are based on the most recent Mortgage that was taken out on this home.
Original Mortgage
$24,550
Interest Rate
6.34%
Mortgage Type
Stand Alone Second
Purchase Details
Closed on
Jul 27, 2005
Sold by
Robinson Michael and Robinson Linda
Bought by
Dmj Properties Llc
Home Financials for this Owner
Home Financials are based on the most recent Mortgage that was taken out on this home.
Original Mortgage
$184,000
Interest Rate
5.56%
Mortgage Type
Purchase Money Mortgage
Create a Home Valuation Report for This Property
The Home Valuation Report is an in-depth analysis detailing your home's value as well as a comparison with similar homes in the area
Home Values in the Area
Average Home Value in this Area
Purchase History
| Date | Buyer | Sale Price | Title Company |
|---|---|---|---|
| Gordon Heidi M | -- | None Listed On Document | |
| Gordon Merril R | $322,450 | Pnwt | |
| Dmj Properties Llc | $230,280 | Chicago Title |
Source: Public Records
Mortgage History
| Date | Status | Borrower | Loan Amount |
|---|---|---|---|
| Previous Owner | Gordon Merril R | $24,550 | |
| Previous Owner | Gordon Merril R | $257,900 | |
| Previous Owner | Dmj Properties Llc | $184,000 |
Source: Public Records
Tax History Compared to Growth
Tax History
| Year | Tax Paid | Tax Assessment Tax Assessment Total Assessment is a certain percentage of the fair market value that is determined by local assessors to be the total taxable value of land and additions on the property. | Land | Improvement |
|---|---|---|---|---|
| 2025 | $5,621 | $697,000 | $455,000 | $242,000 |
| 2024 | $5,621 | $699,000 | $457,000 | $242,000 |
| 2023 | $5,079 | $709,900 | $466,500 | $243,400 |
| 2022 | $4,692 | $539,300 | $331,200 | $208,100 |
| 2020 | $4,425 | $448,600 | $270,000 | $178,600 |
| 2019 | $4,255 | $433,700 | $256,500 | $177,200 |
| 2018 | $4,197 | $372,500 | $213,300 | $159,200 |
| 2017 | $3,575 | $334,300 | $184,500 | $149,800 |
| 2016 | $3,153 | $306,500 | $162,000 | $144,500 |
| 2015 | $2,919 | $266,100 | $139,500 | $126,600 |
| 2013 | $2,504 | $216,700 | $108,000 | $108,700 |
Source: Public Records
Map
Nearby Homes
- 23902 48th Ave W
- 4908 236th St SW
- 23502 Peterson Dr
- 4902 241st St SW
- 24007 44th Ave W
- 23319 Cedar Way Unit K105
- 24212 52nd Ave W
- 23301 Cedar Way Unit U102
- 23103 52nd Ave W
- 23325 Cedar Way Unit G105
- 5410 240th St SW
- 5502 240th St SW Unit C304
- 23004 52nd Ave W
- 23806 56th Ave W Unit B
- 24222 54th Ave W Unit 19
- 4603 227th St SW
- 4009 229th Place SW
- 23901 59th Place W
- 20318 19th Ave NE
- 22912 39th Ave W
- 4709 237th Place SW
- 4703 237th Place SW
- 23704 48th Ave W
- 4712 237th Place SW
- 23609 48th Ave W
- 23706 48th Ave W
- 23608 48th Ave W
- 4709 237th St SW
- 4706 237th St SW
- 23707 48th Ave W
- 4701 237th Place SW
- 23708 48th Ave W
- 4802 237th St SW
- 23606 48th Ave W
- 4706 237th Place SW
- 23601 48th Ave W
- 4804 237th St SW
- 4704 237th St SW
- 23604 48th Ave W
- 4707 238th Place SW