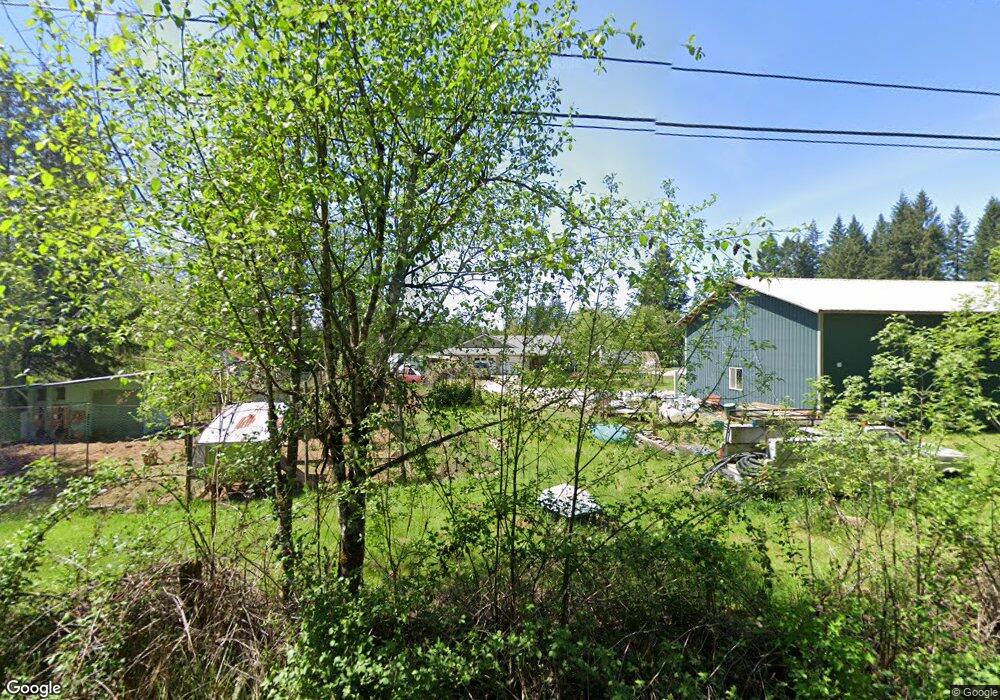
23706 NE 182nd Ave Battle Ground, WA 98604
Estimated Value: $751,268 - $793,000
3
Beds
3
Baths
1,794
Sq Ft
$430/Sq Ft
Est. Value
About This Home
This home is located at 23706 NE 182nd Ave, Battle Ground, WA 98604 and is currently estimated at $771,423, approximately $430 per square foot. 23706 NE 182nd Ave is a home located in Clark County with nearby schools including Tukes Valley Primary School, Tukes Valley Middle School, and Battle Ground High School.
Ownership History
Date
Name
Owned For
Owner Type
Purchase Details
Closed on
Aug 16, 2021
Sold by
Rae Angus D
Bought by
Rae Angus D and Rae Donna M
Current Estimated Value
Home Financials for this Owner
Home Financials are based on the most recent Mortgage that was taken out on this home.
Original Mortgage
$225,000
Interest Rate
2.9%
Mortgage Type
New Conventional
Purchase Details
Closed on
Feb 11, 2021
Sold by
Rae B Kate and B Kate Rae Living Trust
Bought by
Rae Angus D
Purchase Details
Closed on
Mar 13, 2012
Sold by
Adams Dan K and Rae Burdella Kate
Bought by
Rae B Kate
Purchase Details
Closed on
Dec 5, 2005
Sold by
Adams Dan K
Bought by
Adams Dan K and Adams Ethel L
Purchase Details
Closed on
Mar 17, 2003
Sold by
Adams De Ette L
Bought by
Adams De Ette L and Adams Dan K
Create a Home Valuation Report for This Property
The Home Valuation Report is an in-depth analysis detailing your home's value as well as a comparison with similar homes in the area
Home Values in the Area
Average Home Value in this Area
Purchase History
| Date | Buyer | Sale Price | Title Company |
|---|---|---|---|
| Rae Angus D | -- | Chicago Title Company Of Wa | |
| Rae Angus D | -- | None Available | |
| Rae B Kate | -- | None Available | |
| Adams Dan K | -- | Fidelity National Title | |
| Adams De Ette L | -- | -- |
Source: Public Records
Mortgage History
| Date | Status | Borrower | Loan Amount |
|---|---|---|---|
| Closed | Rae Angus D | $225,000 |
Source: Public Records
Tax History Compared to Growth
Tax History
| Year | Tax Paid | Tax Assessment Tax Assessment Total Assessment is a certain percentage of the fair market value that is determined by local assessors to be the total taxable value of land and additions on the property. | Land | Improvement |
|---|---|---|---|---|
| 2025 | $3,648 | $660,975 | $284,753 | $376,222 |
| 2024 | $3,286 | $634,128 | $284,753 | $349,375 |
| 2023 | $3,565 | $655,998 | $296,312 | $359,686 |
| 2022 | $3,553 | $636,654 | $274,941 | $361,713 |
| 2021 | $3,439 | $516,367 | $196,149 | $320,218 |
| 2020 | $3,422 | $483,241 | $209,852 | $273,389 |
| 2019 | $2,983 | $463,806 | $197,862 | $265,944 |
| 2018 | $3,123 | $332,611 | $0 | $0 |
| 2017 | $2,800 | $265,001 | $0 | $0 |
| 2016 | $2,650 | $259,128 | $0 | $0 |
| 2015 | $2,608 | $224,848 | $0 | $0 |
| 2014 | -- | $209,205 | $0 | $0 |
| 2013 | -- | $177,526 | $0 | $0 |
Source: Public Records
Map
Nearby Homes
- 22814 NE 182nd Ave
- 18205 NE 249th St
- 19301 NE 249th St
- 16105 NE 241st Cir
- 22405 NE 167th Ave
- 19815 NE Allworth Rd
- 20015 NE 234th St
- 17811 NE 259th St
- 21405 NE 167th Ave
- 20607 NE Allworth Rd
- 19428 NE 259th St
- 1720 NE 12th St
- 1308 NE 18th Ave
- 1313 NE 17th Ave
- 1216 NE 17th Ave
- 25600 NE 152nd Ave
- 0 212th Ave
- 1188 NE 19th St
- 20205 NE 190th Ave
- 25307 NE 212th Ave
- 23804 NE 182nd Ave
- 23826 NE 182nd Ave
- 23428 NE 182nd Ave
- 17921 NE 240th Cir
- 17901 NE 240th Cir
- 23843 NE 182nd Ave
- 23531 NE 182nd Ave
- 17809 NE 240th Cir
- 24104 NE 182nd Ave
- 23309 NE 182nd Ave
- 24103 NE 182nd Ave
- 23841 NE 182nd Ave
- 23619 NE 174th Ct
- 18321 NE 234th St
- 18411 NE 234th St
- 24211 NE 177th Ct
- 23913 NE 174th Ct
- 18505 NE 234th St
- 23615 NE 174th Ct
- 24311 NE Crawford Rd