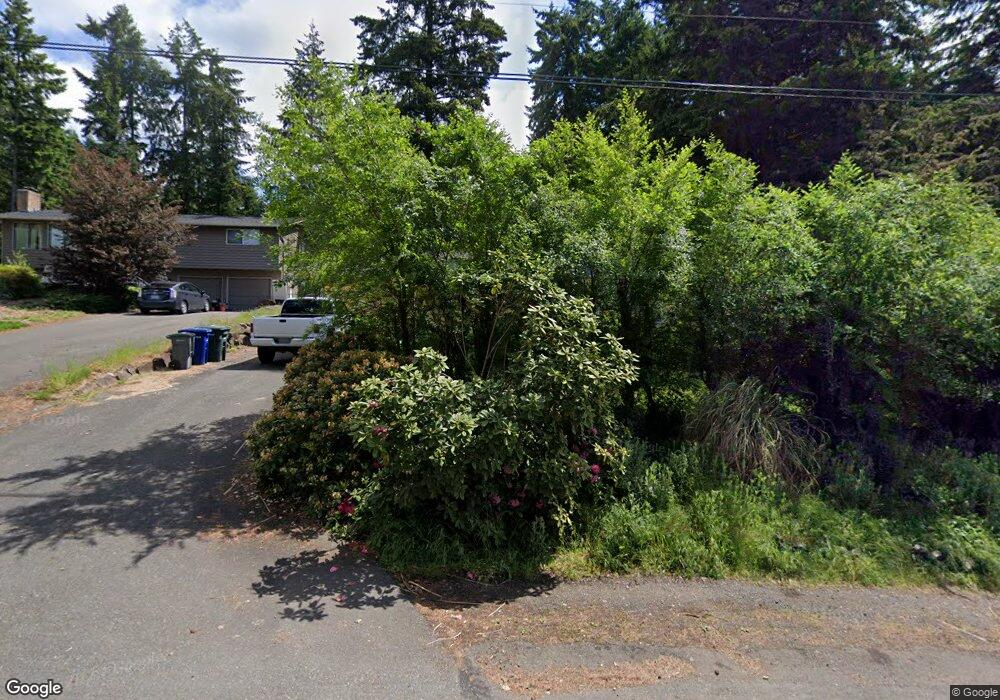
23709 7th Ave W Bothell, WA 98021
Queensborough-Brentwood NeighborhoodEstimated Value: $712,000 - $801,000
3
Beds
2
Baths
1,242
Sq Ft
$610/Sq Ft
Est. Value
About This Home
This home is located at 23709 7th Ave W, Bothell, WA 98021 and is currently estimated at $757,240, approximately $609 per square foot. 23709 7th Ave W is a home located in Snohomish County with nearby schools including Shelton View Elementary School, Canyon Park Junior High School, and Bothell High School.
Ownership History
Date
Name
Owned For
Owner Type
Purchase Details
Closed on
Apr 29, 2019
Sold by
Lilleberg Ann K
Bought by
Bowman Max E and Lilleberg Ann K
Current Estimated Value
Home Financials for this Owner
Home Financials are based on the most recent Mortgage that was taken out on this home.
Original Mortgage
$297,000
Outstanding Balance
$257,864
Interest Rate
4.2%
Mortgage Type
New Conventional
Estimated Equity
$499,376
Purchase Details
Closed on
Nov 20, 2009
Sold by
Norton Worth H
Bought by
Lilleberg Ann K
Home Financials for this Owner
Home Financials are based on the most recent Mortgage that was taken out on this home.
Original Mortgage
$265,109
Interest Rate
5.25%
Mortgage Type
FHA
Purchase Details
Closed on
Apr 27, 1994
Sold by
Evered Joy Ann
Bought by
Thornley Malcolm and Thornley Georgia June
Home Financials for this Owner
Home Financials are based on the most recent Mortgage that was taken out on this home.
Original Mortgage
$32,950
Interest Rate
7.38%
Create a Home Valuation Report for This Property
The Home Valuation Report is an in-depth analysis detailing your home's value as well as a comparison with similar homes in the area
Home Values in the Area
Average Home Value in this Area
Purchase History
| Date | Buyer | Sale Price | Title Company |
|---|---|---|---|
| Bowman Max E | -- | First American Title | |
| Lilleberg Ann K | $270,000 | Rainier Title | |
| Thornley Malcolm | $132,950 | Chicago Title Insurance Co |
Source: Public Records
Mortgage History
| Date | Status | Borrower | Loan Amount |
|---|---|---|---|
| Open | Bowman Max E | $297,000 | |
| Closed | Lilleberg Ann K | $265,109 | |
| Previous Owner | Thornley Malcolm | $32,950 |
Source: Public Records
Tax History
| Year | Tax Paid | Tax Assessment Tax Assessment Total Assessment is a certain percentage of the fair market value that is determined by local assessors to be the total taxable value of land and additions on the property. | Land | Improvement |
|---|---|---|---|---|
| 2026 | $5,909 | $732,900 | $580,000 | $152,900 |
| 2025 | $5,302 | $693,900 | $545,000 | $148,900 |
| 2024 | $5,302 | $618,900 | $470,000 | $148,900 |
| 2023 | $6,089 | $781,500 | $600,000 | $181,500 |
| 2022 | $5,276 | $545,000 | $390,000 | $155,000 |
| 2020 | $4,902 | $469,900 | $311,000 | $158,900 |
| 2019 | $4,254 | $421,200 | $265,000 | $156,200 |
| 2018 | $3,987 | $380,100 | $240,000 | $140,100 |
| 2017 | $3,269 | $313,400 | $180,000 | $133,400 |
| 2016 | $2,874 | $283,600 | $155,000 | $128,600 |
| 2015 | $2,872 | $269,200 | $143,000 | $126,200 |
| 2013 | $2,589 | $213,200 | $113,000 | $100,200 |
Source: Public Records
Map
Nearby Homes
- 23826 7th Place W
- 23619 5th Ave W
- 23716 9th Place W
- 23812 Lake Dr E
- 931 236th Place SW
- 24114 7th Place W
- 24123 7th Ave W
- 1017 236th Place SW
- 23728 Vista View Ave
- 1121 244th St SW Unit 11
- 1121 244th St SW Unit 66
- 20343 75th Ave NE
- 18 232nd Place SW
- 17 232nd Place SE
- 714 228th St SW Unit O101
- 7543 NE 203rd St
- 404 228th St SW Unit E101
- 20103 75th Ave NE
- 1425 243rd Place SW
- 22827 Meridian Ave S
- 23705 7th Ave W
- 23721 7th Ave W
- 23727 7th Ave W
- 23714 7th Ave W
- 23726 5th Ave W
- 23628 5th Ave W
- 23718 7th Ave W
- 23710 7th Ave W
- 23805 7th Ave W
- 23726 7th Ave W
- 23630 7th Ave W
- 23622 5th Ave W
- 23710 5th Ave W
- 23804 7th Ave W
- 23613 7th Ave W
- 23811 7th Ave W
- 23626 5th Ave W
- 23724 5th Ave W
- 23717 7th Place W
Your Personal Tour Guide
Ask me questions while you tour the home.