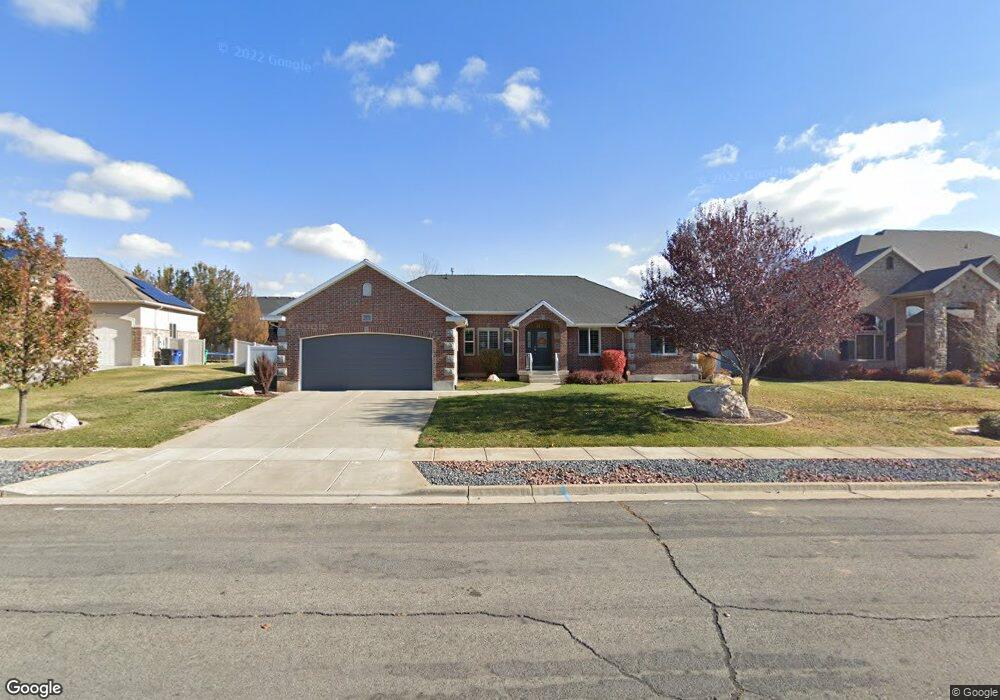
2371 S 825 W Syracuse, UT 84075
Estimated Value: $708,000 - $757,000
5
Beds
4
Baths
2,066
Sq Ft
$358/Sq Ft
Est. Value
About This Home
This home is located at 2371 S 825 W, Syracuse, UT 84075 and is currently estimated at $739,542, approximately $357 per square foot. 2371 S 825 W is a home located in Davis County with nearby schools including Bluff Ridge Elementary, Legacy Junior High School, and Clearfield High School.
Ownership History
Date
Name
Owned For
Owner Type
Purchase Details
Closed on
Mar 18, 2025
Sold by
Gailey Jared N and Gailey Anita R
Bought by
Jared And Anita Gailey Living Trust and Gailey
Current Estimated Value
Purchase Details
Closed on
Jan 11, 2021
Sold by
Gailey Jared N and Gailey Anita R
Bought by
Gailey Jared Nelson and Gailey Anita Renate
Home Financials for this Owner
Home Financials are based on the most recent Mortgage that was taken out on this home.
Original Mortgage
$95,900
Interest Rate
2.71%
Mortgage Type
New Conventional
Purchase Details
Closed on
May 20, 2004
Sold by
Scott Baker Construction Inc
Bought by
Gailey Jared N and Gailey Anita R
Create a Home Valuation Report for This Property
The Home Valuation Report is an in-depth analysis detailing your home's value as well as a comparison with similar homes in the area
Home Values in the Area
Average Home Value in this Area
Purchase History
| Date | Buyer | Sale Price | Title Company |
|---|---|---|---|
| Jared And Anita Gailey Living Trust | -- | None Listed On Document | |
| Jared And Anita Gailey Living Trust | -- | None Listed On Document | |
| Gailey Jared Nelson | -- | First American Title | |
| Gailey Jared N | -- | Bonneville Title Company Inc |
Source: Public Records
Mortgage History
| Date | Status | Borrower | Loan Amount |
|---|---|---|---|
| Previous Owner | Gailey Jared Nelson | $95,900 |
Source: Public Records
Tax History
| Year | Tax Paid | Tax Assessment Tax Assessment Total Assessment is a certain percentage of the fair market value that is determined by local assessors to be the total taxable value of land and additions on the property. | Land | Improvement |
|---|---|---|---|---|
| 2025 | $3,859 | $372,350 | $131,406 | $240,944 |
| 2024 | $3,828 | $371,800 | $115,144 | $256,656 |
| 2023 | $3,616 | $640,000 | $160,059 | $479,941 |
| 2022 | $3,798 | $368,500 | $91,230 | $277,270 |
| 2021 | $3,349 | $503,000 | $135,566 | $367,434 |
| 2020 | $3,046 | $443,000 | $114,822 | $328,178 |
| 2019 | $2,967 | $426,000 | $116,246 | $309,754 |
| 2018 | $2,800 | $399,000 | $110,096 | $288,904 |
| 2016 | $2,641 | $197,340 | $42,110 | $155,230 |
| 2015 | $2,842 | $202,235 | $42,110 | $160,125 |
| 2014 | $2,907 | $187,000 | $42,110 | $144,890 |
| 2013 | -- | $163,694 | $38,913 | $124,781 |
Source: Public Records
Map
Nearby Homes
- 2359 S 825 W
- 2383 S 825 W
- 774 W 2400 S
- 2346 Bluff Ridge Dr
- 2366 Bluff Ridge Dr
- 2368 S 825 W
- 2347 S 825 W
- 2356 S 825 W
- 809 W 2400 S
- 2328 Bluff Ridge Dr
- 791 W 2400 S
- 856 W 2400 S
- 2344 S 825 W
- 2381 Bluff Ridge Dr
- 827 W 2400 S
- 2361 Bluff Ridge Dr
- 845 W 2400 S
- 773 W 2400 S
- 2343 Bluff Ridge Dr
- 817 W 2300 S
Your Personal Tour Guide
Ask me questions while you tour the home.