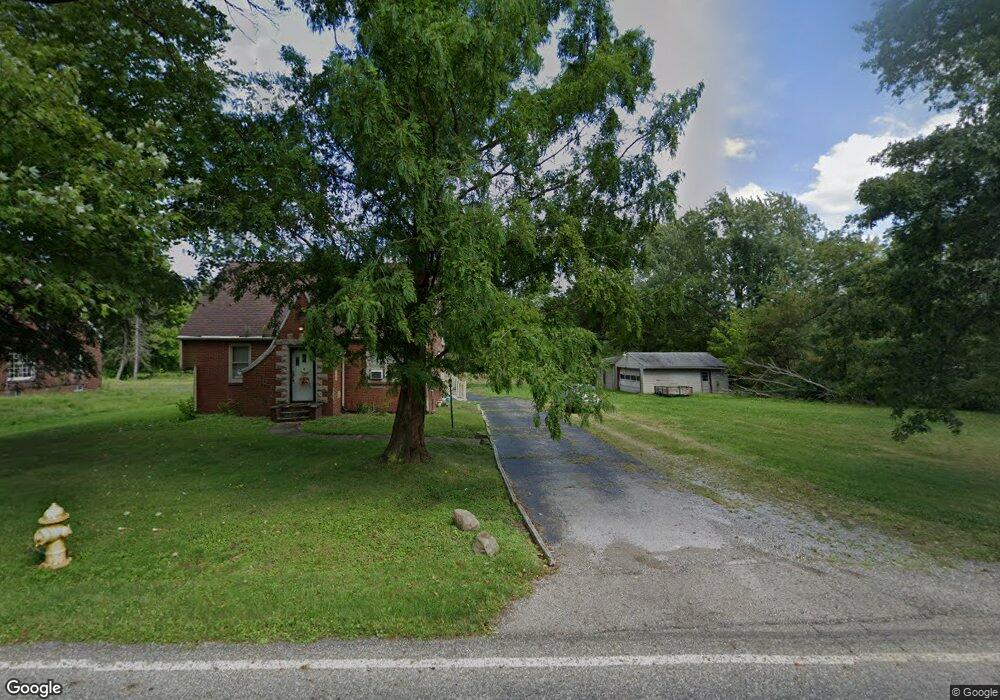
2371 Stillwagon Rd SE Warren, OH 44484
Estimated Value: $90,000 - $155,000
3
Beds
1
Bath
1,514
Sq Ft
$80/Sq Ft
Est. Value
About This Home
This home is located at 2371 Stillwagon Rd SE, Warren, OH 44484 and is currently estimated at $120,615, approximately $79 per square foot. 2371 Stillwagon Rd SE is a home located in Trumbull County with nearby schools including Howland High School, Summit Academy Community School - Warren, and John F. Kennedy Catholic School - Upper Campus.
Ownership History
Date
Name
Owned For
Owner Type
Purchase Details
Closed on
Jun 28, 2025
Sold by
Hlaudy Richard S
Bought by
Cohol John
Current Estimated Value
Purchase Details
Closed on
Dec 17, 2009
Sold by
Imb Reo Llc
Bought by
Hlaudy Richard S
Purchase Details
Closed on
Nov 13, 2009
Sold by
Delung Eric
Bought by
Imb Reo Llc
Purchase Details
Closed on
Oct 12, 2005
Sold by
Delung Beatrice D
Bought by
Delung Eric D
Purchase Details
Closed on
Oct 7, 2005
Sold by
Delung Beatrice D
Bought by
Delung Eric D
Purchase Details
Closed on
Oct 1, 2003
Sold by
Delung Nancy Lee
Bought by
Delung Earl and Delung Beatrice D
Home Financials for this Owner
Home Financials are based on the most recent Mortgage that was taken out on this home.
Original Mortgage
$71,000
Interest Rate
6.4%
Mortgage Type
New Conventional
Purchase Details
Closed on
Jan 1, 1990
Bought by
Earl and Nancy Lee
Create a Home Valuation Report for This Property
The Home Valuation Report is an in-depth analysis detailing your home's value as well as a comparison with similar homes in the area
Home Values in the Area
Average Home Value in this Area
Purchase History
| Date | Buyer | Sale Price | Title Company |
|---|---|---|---|
| Cohol John | -- | None Listed On Document | |
| Hlaudy Richard S | $35,000 | Attorney | |
| Imb Reo Llc | $50,000 | None Available | |
| Delung Eric D | -- | Shamrock Title | |
| Delung Eric D | -- | Shamrock Title | |
| Delung Earl | -- | -- | |
| Earl | -- | -- |
Source: Public Records
Mortgage History
| Date | Status | Borrower | Loan Amount |
|---|---|---|---|
| Previous Owner | Delung Earl | $71,000 |
Source: Public Records
Tax History Compared to Growth
Tax History
| Year | Tax Paid | Tax Assessment Tax Assessment Total Assessment is a certain percentage of the fair market value that is determined by local assessors to be the total taxable value of land and additions on the property. | Land | Improvement |
|---|---|---|---|---|
| 2024 | $839 | $15,480 | $10,190 | $5,290 |
| 2023 | $839 | $15,480 | $10,190 | $5,290 |
| 2022 | $883 | $13,720 | $9,380 | $4,340 |
| 2021 | $863 | $13,720 | $9,380 | $4,340 |
| 2020 | $866 | $13,720 | $9,380 | $4,340 |
| 2019 | $854 | $12,810 | $8,680 | $4,130 |
| 2018 | $818 | $12,810 | $8,680 | $4,130 |
| 2017 | $737 | $12,810 | $8,680 | $4,130 |
| 2016 | $777 | $13,130 | $10,750 | $2,380 |
| 2015 | $759 | $13,130 | $10,750 | $2,380 |
| 2014 | $732 | $13,130 | $10,750 | $2,380 |
| 2013 | $728 | $13,130 | $10,750 | $2,380 |
Source: Public Records
Map
Nearby Homes
- 2311 Stillwagon Rd SE
- 8028 Mines Rd SE
- 1589 Stillwagon Rd
- 2717 Niles Vienna Rd
- 924 Nob Hill Dr Unit 3
- 906 Nob Hill Dr Unit 3
- 1005 Forest Pointe Ct SE
- 1283 Stillwagon Rd SE
- 8650 Hidden Hills Dr SE
- 9043 Howland Springs Rd SE
- 1863 Merlo Ct
- 108 Riviera Ct SE
- 1499 Butterfield Cir
- 2135 Isabelle Dr
- 1561 Niles Cortland Rd SE
- 2139 Coates Dr
- 449 Westchester Dr SE
- 5960 Mines Rd SE
- 1414 Niles Cortland Rd
- 138 Mill Creek Rd
- 2357 Stillwagon Rd SE
- 2349 Stillwagon Rd SE
- 2395 Stillwagon Rd SE
- 2348 Stillwagon Rd SE
- 2325 Stillwagon Rd SE
- 2380 Stillwagon Rd SE
- 2370 Stillwagon Rd SE
- 2338 Stillwagon Rd SE
- 2297 Stillwagon Rd SE
- 2390 Stillwagon Rd SE
- 2310 Stillwagon Rd SE
- 2296 Stillwagon Rd SE
- 2446 Stillwagon Rd SE
- 2469 Stillwagon Rd SE
- 2257 Stillwagon Rd SE
- 2282 Stillwagon Rd SE
- 2456 Stillwagon Rd SE
- 2255 Stillwagon Rd SE
- 2475 Stillwagon Rd SE
- 8099 Mines Rd SE