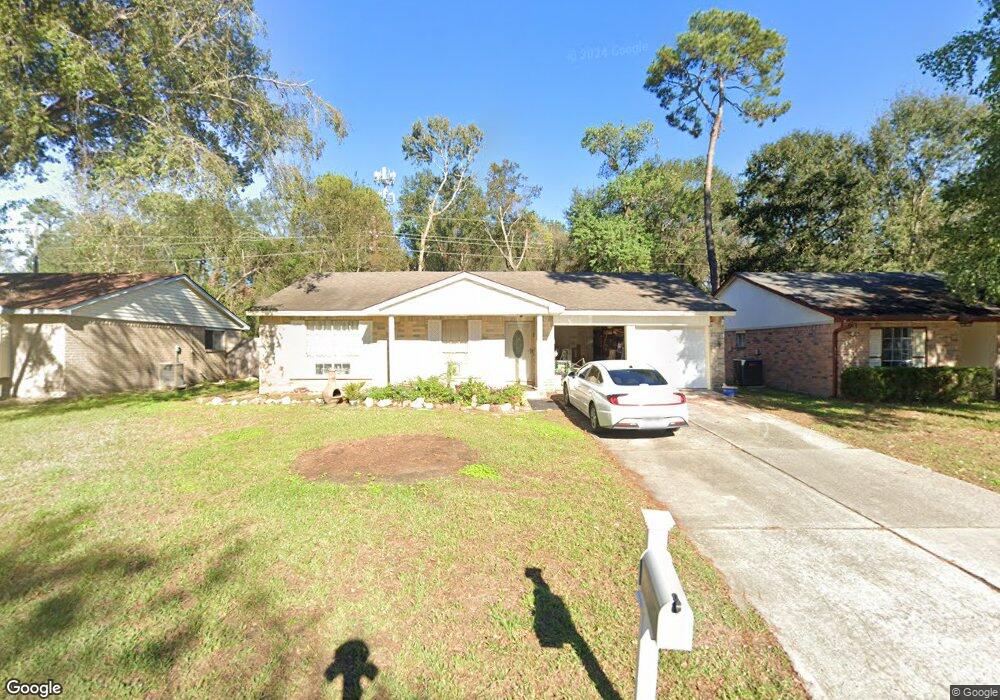
23710 Wintergate Dr Spring, TX 77373
Estimated Value: $197,000 - $215,891
3
Beds
2
Baths
1,350
Sq Ft
$152/Sq Ft
Est. Value
About This Home
This home is located at 23710 Wintergate Dr, Spring, TX 77373 and is currently estimated at $205,723, approximately $152 per square foot. 23710 Wintergate Dr is a home located in Harris County with nearby schools including Mildred Jenkins Elementary School, Dueitt Middle School, and Spring High School.
Ownership History
Date
Name
Owned For
Owner Type
Purchase Details
Closed on
Jul 24, 2012
Sold by
Stamm Wanda Jo and Estate Of Lloyd Albert Stamm
Bought by
Hometown Mortgage Company Inc
Current Estimated Value
Home Financials for this Owner
Home Financials are based on the most recent Mortgage that was taken out on this home.
Original Mortgage
$56,700
Outstanding Balance
$39,232
Interest Rate
3.72%
Mortgage Type
New Conventional
Estimated Equity
$166,491
Purchase Details
Closed on
Sep 29, 1995
Sold by
Smith John William and Smith Charlene D
Bought by
Stamm Lloyd Albert and Stamm Wanda Jo
Home Financials for this Owner
Home Financials are based on the most recent Mortgage that was taken out on this home.
Original Mortgage
$52,381
Interest Rate
8%
Mortgage Type
VA
Create a Home Valuation Report for This Property
The Home Valuation Report is an in-depth analysis detailing your home's value as well as a comparison with similar homes in the area
Home Values in the Area
Average Home Value in this Area
Purchase History
| Date | Buyer | Sale Price | Title Company |
|---|---|---|---|
| Hometown Mortgage Company Inc | -- | Grent American Title Co | |
| Stamm Lloyd Albert | -- | First American Title |
Source: Public Records
Mortgage History
| Date | Status | Borrower | Loan Amount |
|---|---|---|---|
| Open | Hometown Mortgage Company Inc | $56,700 | |
| Previous Owner | Stamm Lloyd Albert | $52,381 |
Source: Public Records
Tax History
| Year | Tax Paid | Tax Assessment Tax Assessment Total Assessment is a certain percentage of the fair market value that is determined by local assessors to be the total taxable value of land and additions on the property. | Land | Improvement |
|---|---|---|---|---|
| 2025 | $4,043 | $254,204 | $38,123 | $216,081 |
| 2024 | $4,043 | $255,123 | $38,123 | $217,000 |
| 2023 | $4,043 | $260,377 | $38,123 | $222,254 |
| 2022 | $4,423 | $236,282 | $38,123 | $198,159 |
| 2021 | $4,260 | $185,639 | $21,548 | $164,091 |
| 2020 | $4,135 | $175,468 | $21,548 | $153,920 |
| 2019 | $3,896 | $160,809 | $21,548 | $139,261 |
| 2018 | $2,953 | $156,036 | $21,548 | $134,488 |
| 2017 | $3,184 | $156,036 | $21,548 | $134,488 |
| 2016 | $2,895 | $117,702 | $14,918 | $102,784 |
| 2015 | $2,093 | $105,424 | $14,918 | $90,506 |
| 2014 | $2,093 | $91,163 | $14,918 | $76,245 |
Source: Public Records
Map
Nearby Homes
- 4538 Burkegate Dr
- 4515 Mossygate Dr
- 4423 Mossygate Dr
- 23815 Firegate Dr
- 4522 Cannongate Dr
- 23430 Wintergate Dr
- 4318 Burkegate Dr
- 23915 Floragate Dr
- 4831 Blue Jacaranda Way
- 4311 Enchantedgate Dr
- 24022 Rockygate Dr
- 4519 Tylergate Dr
- 4827 Tealgate Dr
- 4919 Hickorygate Dr
- 4610 Sloangate Dr
- 4911 Tealgate Dr
- 4303 Chestergate Dr
- 4527 Adonis Dr
- 23663 Rainbow Eucalyptus Dr
- 4307 Sloangate Dr
- 23706 Wintergate Dr
- 23714 Wintergate Dr
- 23702 Wintergate Dr
- 4535 Rosegate Dr
- 23634 Wintergate Dr
- 23802 Wintergate Dr
- 4531 Rosegate Dr
- 4526 Mossygate Dr
- 23630 Wintergate Dr
- 4531 Mossygate Dr
- 4534 Rosegate Dr
- 4527 Rosegate Dr
- 4522 Mossygate Dr
- 23626 Wintergate Dr
- 4527 Mossygate Dr
- 4602 Hickorygate Dr
- 4606 Hickorygate Dr
- 4530 Rosegate Dr
- 4610 Hickorygate Dr
- 4523 Rosegate Dr
Your Personal Tour Guide
Ask me questions while you tour the home.