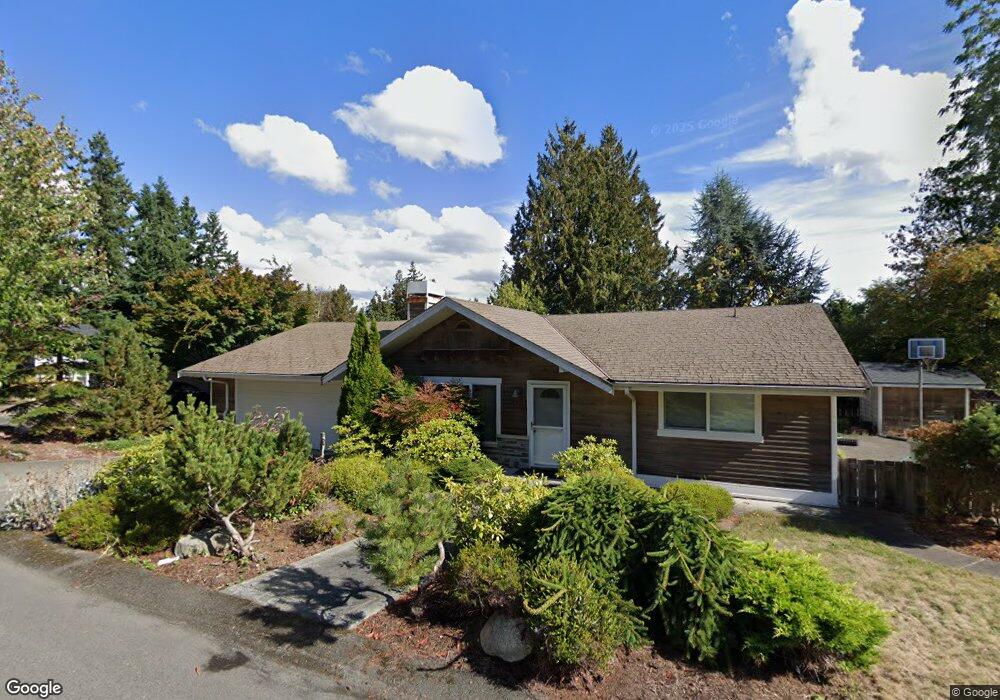
23711 78th Ave W Edmonds, WA 98026
Esperance NeighborhoodEstimated Value: $802,475 - $896,000
3
Beds
2
Baths
1,458
Sq Ft
$594/Sq Ft
Est. Value
About This Home
This home is located at 23711 78th Ave W, Edmonds, WA 98026 and is currently estimated at $865,869, approximately $593 per square foot. 23711 78th Ave W is a home located in Snohomish County with nearby schools including Westgate Elementary School, College Place Middle School, and Edmonds-Woodway High School.
Ownership History
Date
Name
Owned For
Owner Type
Purchase Details
Closed on
May 6, 2010
Sold by
Degrazia Karen C
Bought by
Tiede Lori L
Current Estimated Value
Home Financials for this Owner
Home Financials are based on the most recent Mortgage that was taken out on this home.
Original Mortgage
$260,000
Outstanding Balance
$175,628
Interest Rate
5.21%
Mortgage Type
New Conventional
Estimated Equity
$690,241
Purchase Details
Closed on
Jun 21, 2006
Sold by
Degrazia Karen C
Bought by
Degrazia Karen C
Purchase Details
Closed on
Nov 6, 2002
Sold by
Degrazia Karen C
Bought by
Degrazia Karen C
Home Financials for this Owner
Home Financials are based on the most recent Mortgage that was taken out on this home.
Original Mortgage
$228,750
Interest Rate
5.95%
Purchase Details
Closed on
Mar 13, 2002
Sold by
Degrazia Karen C
Bought by
Degrazia Karen C
Purchase Details
Closed on
Jan 19, 2001
Sold by
Belt Thomas R
Bought by
Degrazia Karen C
Home Financials for this Owner
Home Financials are based on the most recent Mortgage that was taken out on this home.
Original Mortgage
$200,000
Interest Rate
7.41%
Create a Home Valuation Report for This Property
The Home Valuation Report is an in-depth analysis detailing your home's value as well as a comparison with similar homes in the area
Home Values in the Area
Average Home Value in this Area
Purchase History
| Date | Buyer | Sale Price | Title Company |
|---|---|---|---|
| Tiede Lori L | $345,000 | Commonwealth Land Title | |
| Degrazia Karen C | -- | None Available | |
| Degrazia Karen C | -- | Chicago Title Insurance Co | |
| Degrazia Karen C | -- | -- | |
| Degrazia Karen C | $250,000 | -- |
Source: Public Records
Mortgage History
| Date | Status | Borrower | Loan Amount |
|---|---|---|---|
| Open | Tiede Lori L | $260,000 | |
| Previous Owner | Degrazia Karen C | $228,750 | |
| Previous Owner | Degrazia Karen C | $200,000 | |
| Closed | Degrazia Karen C | $97,000 |
Source: Public Records
Tax History Compared to Growth
Tax History
| Year | Tax Paid | Tax Assessment Tax Assessment Total Assessment is a certain percentage of the fair market value that is determined by local assessors to be the total taxable value of land and additions on the property. | Land | Improvement |
|---|---|---|---|---|
| 2025 | $5,165 | $723,400 | $496,000 | $227,400 |
| 2024 | $5,165 | $731,500 | $498,000 | $233,500 |
| 2023 | $5,302 | $778,300 | $513,000 | $265,300 |
| 2022 | $5,052 | $609,900 | $385,000 | $224,900 |
| 2020 | $4,964 | $534,200 | $339,000 | $195,200 |
| 2019 | $4,411 | $478,500 | $315,000 | $163,500 |
| 2018 | $4,533 | $424,800 | $279,000 | $145,800 |
| 2017 | $3,865 | $379,400 | $244,000 | $135,400 |
| 2016 | $3,445 | $335,300 | $208,000 | $127,300 |
| 2015 | $3,454 | $316,600 | $189,000 | $127,600 |
| 2013 | $3,153 | $272,900 | $142,000 | $130,900 |
Source: Public Records
Map
Nearby Homes
- 7907 240th St SW
- 7901 240th St SW
- 23727 80th Ct W
- 7914 242nd St SW
- 8017 234th St SW Unit 325
- 23116 80th Place W
- 8517 242nd St SW Unit 402
- 1621 N 201st St
- 8615 238th St SW Unit B101
- 23509 Lakeview Dr Unit A101
- 23405 Lakeview Dr Unit H306
- 23001 Lakeview Dr Unit I103
- 7818 228th St SW Unit 106
- 8515 244th St SW Unit A2
- 8614 Madrona Ln
- 8603 244th St SW Unit 2D
- 1415 N 200th St Unit B1
- 20314 N Park Ave N
- 1138 N 198th St Unit D303
- 23601 Edmonds Way
- 23807 77th Place W
- 23730 77th Ave W
- 23800 77th Place W
- 23705 78th Ave W
- 23720 77th Ave W
- 23707 78th Ave W
- 23804 77th Ave W
- 23700 77th Ave W
- 23811 77th Place W
- 23803 78th Ave W
- 23805 77th Place W
- 7729 238th St SW
- 23629 78th Ave W
- 23703 78th Ave W
- 23701 78th Ave W
- 23703 77th Ave W
- 23811 78th Ave W
- 7707 238th Place SW
- 23707 77th Ave W
- 23631 78th Ave W