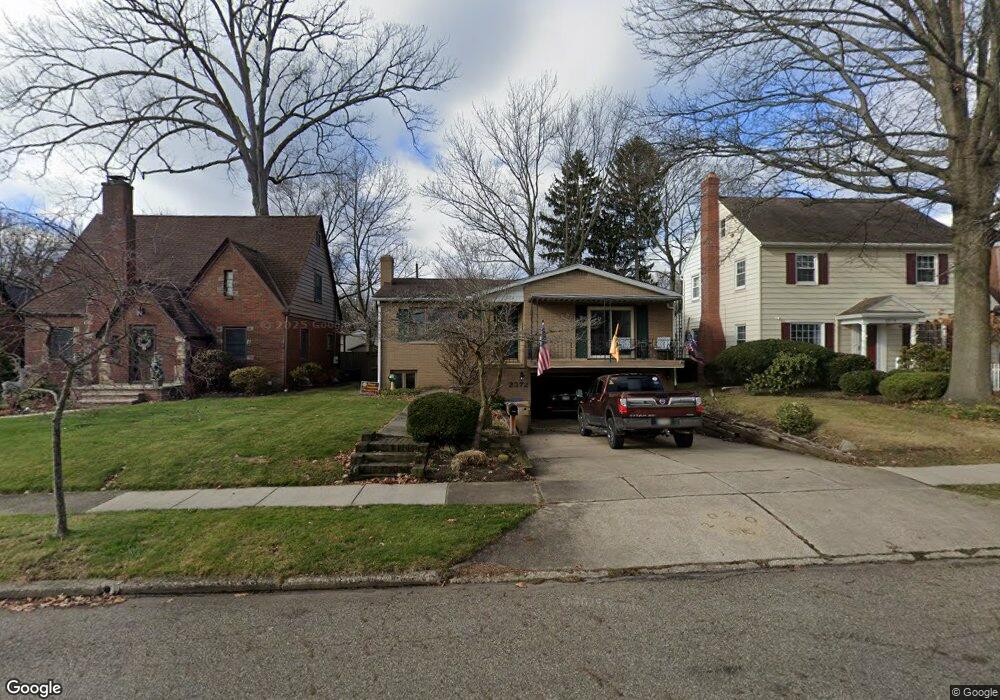
2372 16th St Cuyahoga Falls, OH 44223
Phelps Avenue NeighborhoodEstimated Value: $266,000 - $292,138
3
Beds
3
Baths
1,715
Sq Ft
$163/Sq Ft
Est. Value
About This Home
This home is located at 2372 16th St, Cuyahoga Falls, OH 44223 and is currently estimated at $279,785, approximately $163 per square foot. 2372 16th St is a home located in Summit County with nearby schools including Richardson Elementary School, Bolich Middle School, and Cuyahoga Falls High School.
Ownership History
Date
Name
Owned For
Owner Type
Purchase Details
Closed on
May 2, 2016
Sold by
Nighman Marlo A
Bought by
Nighman James L
Current Estimated Value
Purchase Details
Closed on
May 8, 2007
Sold by
Coyle E Louise
Bought by
Nighman James L and Nighman Marlo A
Home Financials for this Owner
Home Financials are based on the most recent Mortgage that was taken out on this home.
Original Mortgage
$126,400
Interest Rate
6.21%
Mortgage Type
Purchase Money Mortgage
Purchase Details
Closed on
Sep 25, 2000
Sold by
Coyle James J and Coyle E Louise
Bought by
Coyle James J and Louise Coyle E
Create a Home Valuation Report for This Property
The Home Valuation Report is an in-depth analysis detailing your home's value as well as a comparison with similar homes in the area
Home Values in the Area
Average Home Value in this Area
Purchase History
| Date | Buyer | Sale Price | Title Company |
|---|---|---|---|
| Nighman James L | -- | None Available | |
| Nighman James L | $158,000 | Lawyers Title Ins | |
| Coyle James J | -- | -- |
Source: Public Records
Mortgage History
| Date | Status | Borrower | Loan Amount |
|---|---|---|---|
| Closed | Nighman James L | $126,400 |
Source: Public Records
Tax History Compared to Growth
Tax History
| Year | Tax Paid | Tax Assessment Tax Assessment Total Assessment is a certain percentage of the fair market value that is determined by local assessors to be the total taxable value of land and additions on the property. | Land | Improvement |
|---|---|---|---|---|
| 2025 | $4,940 | $91,494 | $13,010 | $78,484 |
| 2024 | $4,940 | $91,494 | $13,010 | $78,484 |
| 2023 | $4,940 | $91,494 | $13,010 | $78,484 |
| 2022 | $4,382 | $65,923 | $9,359 | $56,564 |
| 2021 | $4,381 | $65,923 | $9,359 | $56,564 |
| 2020 | $4,310 | $65,920 | $9,360 | $56,560 |
| 2019 | $3,356 | $46,740 | $9,360 | $37,380 |
| 2018 | $2,850 | $46,740 | $9,360 | $37,380 |
| 2017 | $2,602 | $46,740 | $9,360 | $37,380 |
| 2016 | $2,604 | $43,250 | $9,360 | $33,890 |
| 2015 | $2,602 | $43,250 | $9,360 | $33,890 |
| 2014 | $2,603 | $43,250 | $9,360 | $33,890 |
| 2013 | $2,798 | $46,890 | $9,360 | $37,530 |
Source: Public Records
Map
Nearby Homes