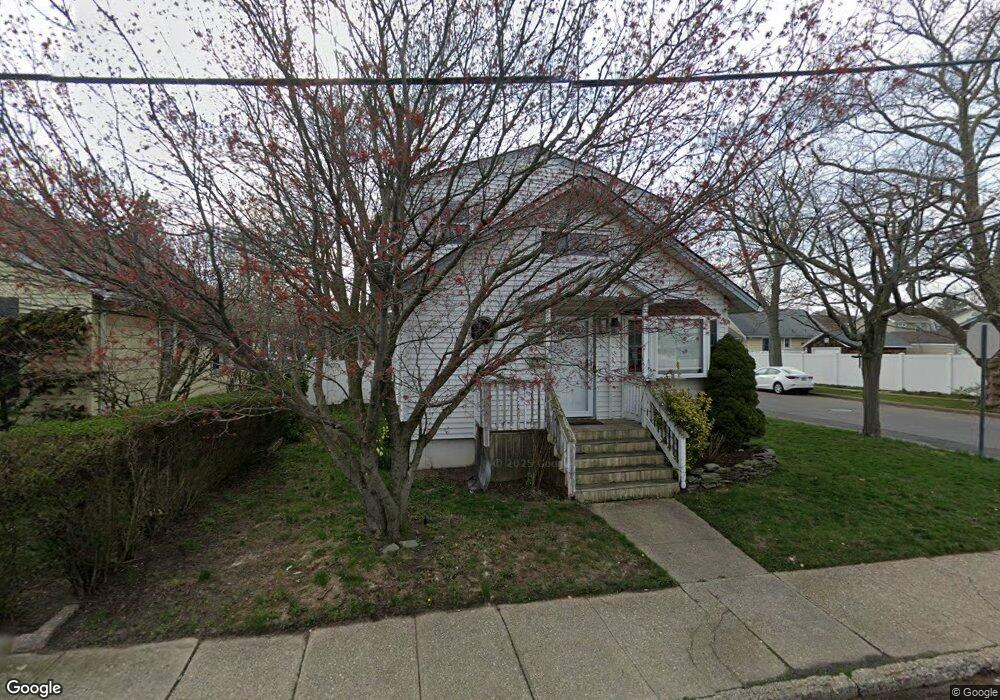
2372 Newbridge Rd Bellmore, NY 11710
Estimated Value: $693,139 - $738,000
3
Beds
2
Baths
1,496
Sq Ft
$478/Sq Ft
Est. Value
About This Home
This home is located at 2372 Newbridge Rd, Bellmore, NY 11710 and is currently estimated at $715,570, approximately $478 per square foot. 2372 Newbridge Rd is a home located in Nassau County with nearby schools including Winthrop Avenue School, Shore Road School, and Grand Avenue Middle School.
Ownership History
Date
Name
Owned For
Owner Type
Purchase Details
Closed on
May 27, 2021
Sold by
Oken Matthew P and Oken Brenda C
Bought by
Rudoy Matthew and Fischer Brittany
Current Estimated Value
Home Financials for this Owner
Home Financials are based on the most recent Mortgage that was taken out on this home.
Original Mortgage
$506,350
Outstanding Balance
$458,437
Interest Rate
2.9%
Mortgage Type
New Conventional
Estimated Equity
$257,133
Purchase Details
Closed on
Mar 31, 2011
Sold by
Hsbc Bank Usa
Bought by
Oken Matthew
Home Financials for this Owner
Home Financials are based on the most recent Mortgage that was taken out on this home.
Original Mortgage
$241,390
Interest Rate
3.5%
Mortgage Type
FHA
Purchase Details
Closed on
Apr 27, 2002
Purchase Details
Closed on
Dec 17, 1998
Sold by
Bogart Calvin
Bought by
Nacinovich Darko
Create a Home Valuation Report for This Property
The Home Valuation Report is an in-depth analysis detailing your home's value as well as a comparison with similar homes in the area
Home Values in the Area
Average Home Value in this Area
Purchase History
| Date | Buyer | Sale Price | Title Company |
|---|---|---|---|
| Rudoy Matthew | $533,000 | Westcor Land Title | |
| Oken Matthew | $280,000 | -- | |
| -- | -- | -- | |
| Nacinovich Darko | $180,000 | -- |
Source: Public Records
Mortgage History
| Date | Status | Borrower | Loan Amount |
|---|---|---|---|
| Open | Rudoy Matthew | $506,350 | |
| Previous Owner | Oken Matthew | $241,390 |
Source: Public Records
Tax History
| Year | Tax Paid | Tax Assessment Tax Assessment Total Assessment is a certain percentage of the fair market value that is determined by local assessors to be the total taxable value of land and additions on the property. | Land | Improvement |
|---|---|---|---|---|
| 2025 | $13,121 | $432 | $147 | $285 |
| 2024 | $3,241 | $426 | $145 | $281 |
Source: Public Records
Map
Nearby Homes
- 2522 Hewlett Ln
- 2542 Lefferts Place
- 23 Bay St
- 204 Howell St
- 2460 Centre Ave
- 308 Saint Marks Ave
- 2500 Centre Ave
- 2573 Legion St
- 163 Wynsum Ave
- 307 Frederick Ave
- 43 Wynsum Ave
- 2474 Margaret St
- 217 Bayview Ave
- No # Clarendon Ave
- 107 1st Place
- 109 Elliot St
- 2829 Frankel Blvd
- 2657 Wilson Ave
- 2675 Anthony Ave
- 2009 Newbridge Rd
- 2380 Newbridge Rd
- 805 Nassau St
- 2384 Newbridge Rd
- 804 Nassau St
- 2358 Newbridge Rd
- 807 Nassau St
- 2375 Newbridge Rd
- 806 Nassau St
- 2388 Newbridge Rd
- 2371 Ocean Ave
- 2363 Newbridge Rd
- 1 Ocean Ave
- 2354 Newbridge Rd
- 710 Hughes St
- 808 Nassau St
- 2355 Newbridge Rd
- 9 Ocean Ave
- 2392 Newbridge Rd
- 2412 Orange St
- 2440 Nassau St
Your Personal Tour Guide
Ask me questions while you tour the home.