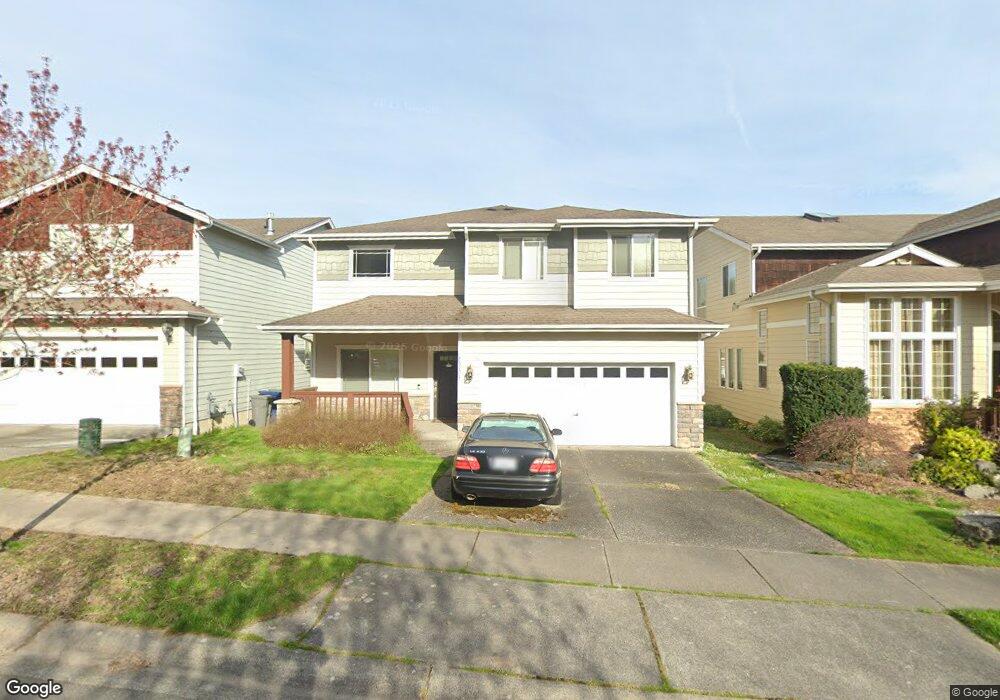
23721 17th Place W Unit Lt 48 Bothell, WA 98021
Queensborough-Brentwood NeighborhoodEstimated Value: $1,051,954 - $1,225,000
4
Beds
3
Baths
2,300
Sq Ft
$490/Sq Ft
Est. Value
About This Home
This home is located at 23721 17th Place W Unit Lt 48, Bothell, WA 98021 and is currently estimated at $1,126,239, approximately $489 per square foot. 23721 17th Place W Unit Lt 48 is a home located in Snohomish County with nearby schools including Lockwood Elementary School, Kenmore Middle School, and Bothell High School.
Ownership History
Date
Name
Owned For
Owner Type
Purchase Details
Closed on
Mar 21, 2018
Sold by
Wang Xiaofeng
Bought by
Jiang Zhenming and Wang Xiaofeng
Current Estimated Value
Home Financials for this Owner
Home Financials are based on the most recent Mortgage that was taken out on this home.
Original Mortgage
$330,000
Outstanding Balance
$282,784
Interest Rate
4.38%
Mortgage Type
New Conventional
Estimated Equity
$843,455
Purchase Details
Closed on
Apr 27, 2015
Sold by
Klepper Christopher A and Klepper Ana
Bought by
Wang Xiaofeng
Purchase Details
Closed on
Apr 14, 2006
Sold by
C S Inc
Bought by
Klepper Christopher A and Klepper Ana
Home Financials for this Owner
Home Financials are based on the most recent Mortgage that was taken out on this home.
Original Mortgage
$45,495
Interest Rate
5.91%
Mortgage Type
Stand Alone Second
Create a Home Valuation Report for This Property
The Home Valuation Report is an in-depth analysis detailing your home's value as well as a comparison with similar homes in the area
Home Values in the Area
Average Home Value in this Area
Purchase History
| Date | Buyer | Sale Price | Title Company |
|---|---|---|---|
| Jiang Zhenming | -- | Cw Title | |
| Wang Xiaofeng | $465,000 | Fidelity National Title | |
| Klepper Christopher A | $454,950 | Chicago Title |
Source: Public Records
Mortgage History
| Date | Status | Borrower | Loan Amount |
|---|---|---|---|
| Open | Jiang Zhenming | $330,000 | |
| Previous Owner | Klepper Christopher A | $45,495 | |
| Previous Owner | Klepper Christopher A | $363,960 |
Source: Public Records
Tax History
| Year | Tax Paid | Tax Assessment Tax Assessment Total Assessment is a certain percentage of the fair market value that is determined by local assessors to be the total taxable value of land and additions on the property. | Land | Improvement |
|---|---|---|---|---|
| 2025 | $7,535 | $903,100 | $520,000 | $383,100 |
| 2024 | $7,535 | $894,800 | $525,000 | $369,800 |
| 2023 | $8,122 | $1,051,500 | $610,000 | $441,500 |
| 2022 | $7,605 | $788,100 | $409,000 | $379,100 |
| 2020 | $6,642 | $639,500 | $318,000 | $321,500 |
| 2019 | $6,229 | $614,800 | $255,000 | $359,800 |
| 2018 | $5,510 | $511,900 | $220,000 | $291,900 |
| 2017 | $4,612 | $439,500 | $165,000 | $274,500 |
| 2016 | $4,436 | $409,300 | $145,000 | $264,300 |
Source: Public Records
Map
Nearby Homes
- 23716 Locust Way
- 23708 Locust Way Unit 23
- 23520 20th Ave W
- 23518 20th Ave W
- 23506 13th Place W
- 23728 Vista View Ave
- 24115 22nd Place W
- 1520 243rd Place SW Unit A
- 1509 243rd Place SW Unit 1
- 1515 243rd Place SW Unit B
- 1528 243rd Place SW Unit A
- 1524 243rd Place SW Unit A
- 1017 236th Place SW
- 1121 244th St SW Unit 11
- 1121 244th St SW Unit 66
- 24004 10th Place W
- 931 236th Place SW
- 23716 9th Place W
- 22827 20th Place W
- 23826 7th Place W
- 23721 17th Place W
- 23721 17th Place W Unit Lt 34
- 23725 17th Place W
- 23725 17th Place W Unit Lt 47
- 23729 17th Place W
- 23729 17th Place W Unit Lt 46
- 23720 17th Ave W
- 23720 17th Ave W Unit Lt 35
- 23724 17th Ave W
- 23724 23724
- 23716 17th Ave W
- 23728 17th Ave W
- 23803 17th Place W
- 23803 17th Place W Unit lt 45
- 23726 17th Place W
- 23726 17th Place W Unit Lot 1
- 23802 17th Ave W Unit Lot 3
- 23802 17th Ave W
- 23802 17th Ave W Unit Lot38
- 23730 17th Place W
Your Personal Tour Guide
Ask me questions while you tour the home.