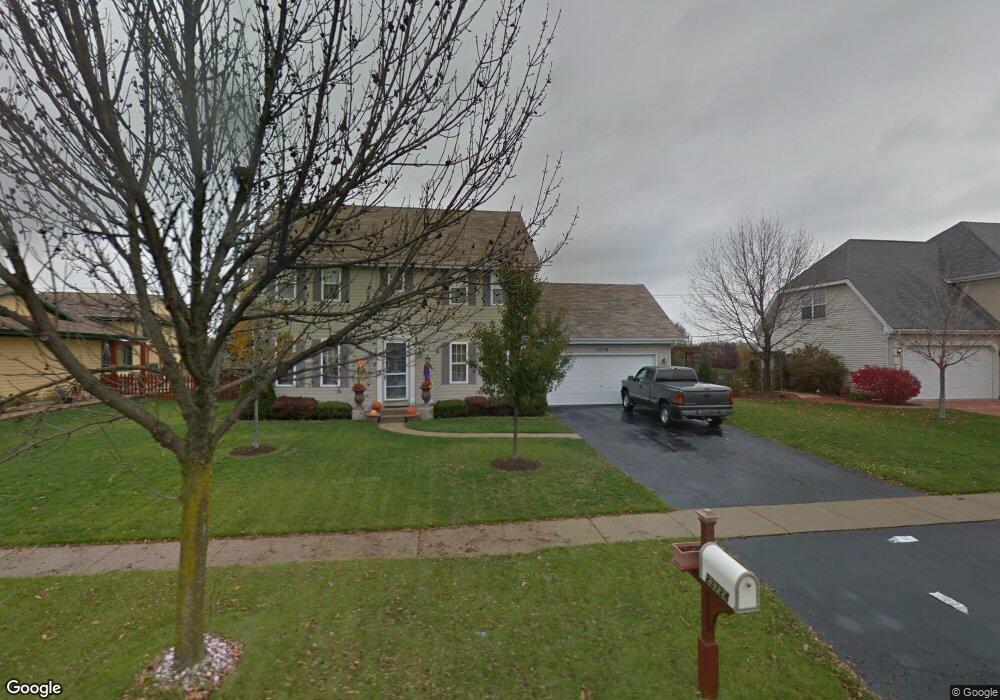
23724 W Orchard Ln Plainfield, IL 60586
East Plainfield NeighborhoodEstimated Value: $352,276 - $462,000
4
Beds
3
Baths
2,040
Sq Ft
$201/Sq Ft
Est. Value
About This Home
This home is located at 23724 W Orchard Ln, Plainfield, IL 60586 and is currently estimated at $410,069, approximately $201 per square foot. 23724 W Orchard Ln is a home located in Will County with nearby schools including Central Elementary School, Indian Trail Middle School, and Plainfield Central High School.
Ownership History
Date
Name
Owned For
Owner Type
Purchase Details
Closed on
Aug 19, 2004
Sold by
Buczkowski Leroy and Buczkowski Noreen
Bought by
Leal Marco
Current Estimated Value
Home Financials for this Owner
Home Financials are based on the most recent Mortgage that was taken out on this home.
Original Mortgage
$213,750
Outstanding Balance
$106,558
Interest Rate
6.08%
Mortgage Type
Purchase Money Mortgage
Estimated Equity
$303,511
Purchase Details
Closed on
Aug 24, 1999
Sold by
Eastwood Ronald F and Eastwood Joanne
Bought by
Buckzrowski Leroy and Buczkowski Noreen
Home Financials for this Owner
Home Financials are based on the most recent Mortgage that was taken out on this home.
Original Mortgage
$175,870
Interest Rate
7.61%
Mortgage Type
FHA
Purchase Details
Closed on
Jun 8, 1995
Sold by
Colony Builders Of Will County
Bought by
Eastwood Ronald F and Eastwood Joanne
Create a Home Valuation Report for This Property
The Home Valuation Report is an in-depth analysis detailing your home's value as well as a comparison with similar homes in the area
Home Values in the Area
Average Home Value in this Area
Purchase History
| Date | Buyer | Sale Price | Title Company |
|---|---|---|---|
| Leal Marco | $225,000 | Chicago Title Insurance Co | |
| Buckzrowski Leroy | $181,000 | Chicago Title Insurance Co | |
| Eastwood Ronald F | $40,000 | Chicago Title Insurance Co | |
| Colony Builders | $36,000 | Chicago Title Insurance Co |
Source: Public Records
Mortgage History
| Date | Status | Borrower | Loan Amount |
|---|---|---|---|
| Open | Leal Marco | $213,750 | |
| Previous Owner | Buckzrowski Leroy | $175,870 |
Source: Public Records
Tax History Compared to Growth
Tax History
| Year | Tax Paid | Tax Assessment Tax Assessment Total Assessment is a certain percentage of the fair market value that is determined by local assessors to be the total taxable value of land and additions on the property. | Land | Improvement |
|---|---|---|---|---|
| 2024 | $7,961 | $115,980 | $30,086 | $85,894 |
| 2023 | $7,961 | $104,751 | $27,173 | $77,578 |
| 2022 | $7,913 | $103,488 | $26,845 | $76,643 |
| 2021 | $7,469 | $96,718 | $25,089 | $71,629 |
| 2020 | $7,360 | $93,974 | $24,377 | $69,597 |
| 2019 | $7,096 | $89,541 | $23,227 | $66,314 |
| 2018 | $6,773 | $84,128 | $21,823 | $62,305 |
| 2017 | $6,557 | $79,946 | $20,738 | $59,208 |
| 2016 | $6,390 | $76,248 | $19,779 | $56,469 |
| 2015 | $6,028 | $71,426 | $18,528 | $52,898 |
| 2014 | $6,028 | $68,904 | $17,874 | $51,030 |
| 2013 | $6,028 | $68,904 | $17,874 | $51,030 |
Source: Public Records
Map
Nearby Homes
- 16040 S Arbor Dr
- 15824 S Collins Dr
- 23538 W Rueben St Unit 6
- 23545 W Rueben St
- 16165 S Arbor Dr
- 15707 S Route 59
- 15623 S Frederick Ave
- 0009 Illinois Route 59
- 0007 Illinois Route 59
- 0006 Illinois Route 59
- 0005 Illinois Route 59
- 0003 Illinois Route 59
- 23516 W Matthews St
- 25747 Yorkshire Dr
- 16410 S Howard St
- 23314 W Leach Dr
- 16402 S Mcgrath Dr
- 23660 Dayfield Ct
- 23924 W Dayfield Dr Unit 23B
- 23105 W Oak St
- 23732 W Orchard Ln
- 23714 W Orchard Ln
- 23721 W Orchard Ln
- 23731 W Orchard Ln
- 23662 W Orchard Ln
- 23703 W Orchard Ln
- 15942 S Lexington Dr
- 15941 S Arbor Dr
- 15910 S Dan Oconnell Dr
- 15930 S Arbor Dr
- 15939 S Lexington Dr
- 23657 W Orchard Ln
- 15938 S Arbor Dr
- 15949 S Lexington Dr Unit 1
- 15938 S Dan Oconnell Dr
- 15952 S Lexington Dr
- 15953 S Arbor Dr
- 15946 S Arbor Dr
- 15911 Fairfield Dr
- 15921 Fairfield Dr