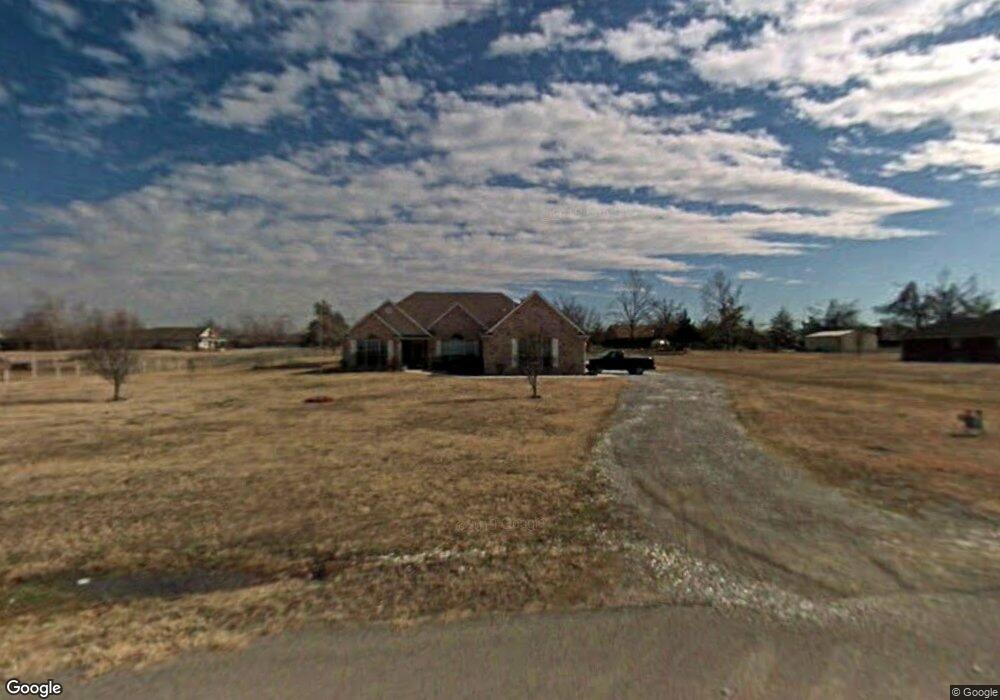
23729 S Southview Dr Claremore, OK 74019
Estimated Value: $277,000 - $331,000
3
Beds
2
Baths
1,851
Sq Ft
$162/Sq Ft
Est. Value
About This Home
This home is located at 23729 S Southview Dr, Claremore, OK 74019 and is currently estimated at $300,162, approximately $162 per square foot. 23729 S Southview Dr is a home located in Rogers County with nearby schools including Catalayah Elementary School, Will Rogers Junior High School, and Claremore High School.
Ownership History
Date
Name
Owned For
Owner Type
Purchase Details
Closed on
Aug 5, 2015
Sold by
Fuhs Donald Robert and Fuhs Mary Louise
Bought by
Evans Craig and Evans Araceli
Current Estimated Value
Home Financials for this Owner
Home Financials are based on the most recent Mortgage that was taken out on this home.
Original Mortgage
$175,483
Interest Rate
4.06%
Mortgage Type
Purchase Money Mortgage
Purchase Details
Closed on
Mar 16, 2006
Sold by
Davis Larry K and Davis Cynthia K
Bought by
Fuhs Donald Robert and Fuhs Mary Louise
Purchase Details
Closed on
Jun 25, 2003
Sold by
Jones Tommy L and Jones Kathy A
Purchase Details
Closed on
Feb 15, 2001
Sold by
Associates~Inc Basler J and Associates~Inc D
Purchase Details
Closed on
Nov 20, 2000
Sold by
Vrex Llc
Purchase Details
Closed on
Sep 5, 2000
Sold by
York Dick Co-Trustee and Jim Seifrie
Purchase Details
Closed on
Oct 18, 1999
Sold by
Basler Basler J and Basler Associates~Inc
Purchase Details
Closed on
Sep 20, 1999
Sold by
Consuegra Luis
Create a Home Valuation Report for This Property
The Home Valuation Report is an in-depth analysis detailing your home's value as well as a comparison with similar homes in the area
Home Values in the Area
Average Home Value in this Area
Purchase History
| Date | Buyer | Sale Price | Title Company |
|---|---|---|---|
| Evans Craig | $170,000 | None Available | |
| Fuhs Donald Robert | $147,000 | First American Title & Abstr | |
| -- | $145,000 | -- | |
| -- | $131,500 | -- | |
| -- | -- | -- | |
| -- | -- | -- | |
| -- | -- | -- | |
| -- | $65,000 | -- |
Source: Public Records
Mortgage History
| Date | Status | Borrower | Loan Amount |
|---|---|---|---|
| Closed | Evans Craig | $175,483 |
Source: Public Records
Tax History Compared to Growth
Tax History
| Year | Tax Paid | Tax Assessment Tax Assessment Total Assessment is a certain percentage of the fair market value that is determined by local assessors to be the total taxable value of land and additions on the property. | Land | Improvement |
|---|---|---|---|---|
| 2025 | $2,388 | $22,723 | $3,544 | $19,179 |
| 2024 | $2,174 | $22,062 | $3,441 | $18,621 |
| 2023 | $2,174 | $21,420 | $3,080 | $18,340 |
| 2022 | $2,047 | $20,796 | $3,080 | $17,716 |
| 2021 | $1,902 | $20,190 | $3,080 | $17,110 |
| 2020 | $1,923 | $19,883 | $3,080 | $16,803 |
| 2019 | $1,883 | $19,196 | $3,080 | $16,116 |
| 2018 | $1,912 | $19,515 | $3,080 | $16,435 |
| 2017 | $1,884 | $19,364 | $3,080 | $16,284 |
| 2016 | $1,966 | $18,898 | $3,080 | $15,818 |
| 2015 | $1,543 | $15,976 | $2,610 | $13,366 |
| 2014 | $1,554 | $15,976 | $2,588 | $13,388 |
Source: Public Records
Map
Nearby Homes
- 11777 E Oak St
- 3015 Frederick Rd
- 10632 E Dogwood Ct
- 1006 W Lawton Rd
- 23288 S Bessie Blvd
- 2105 S Lakin Ln
- 23079 Bessie Blvd
- 1107 W Lawton Rd
- 1105 W Lawton Rd
- 2620 S Piguet Ln
- 1010 W Fargo Rd
- 23394 S Becky Blvd
- 1008 W Lawton Rd
- 23156 S Mae Dr
- 23132 S Jewell Dr
- RC Fenway Plan at Red Plains
- RC Wright Plan at Red Plains
- RC Foster II Plan at Red Plains
- RC Armstrong II Plan at Red Plains
- RC Davenport Plan at Red Plains
- 23729 S South View Dr
- 23749 S Southview Dr
- 23749 S South View Dr
- 23709 S South View Dr
- 23709 S Southview Dr
- 23730 S South View Dr
- 23730 S Southview Dr
- 23688 S Southridge Dr
- 23688 S South Ridge Dr
- 23734 S Ridge Dr
- 23710 S South View Dr
- 23750 S Southview Dr
- 23734 S South Ridge Dr
- 23750 S South View Dr
- 23648 S South Ridge Dr
- 23710 S Southview Dr
- 23769 S South View Dr
- 23685 S South View Dr
- 23772 S South Ridge Dr
- 23705 S South Ridge Dr