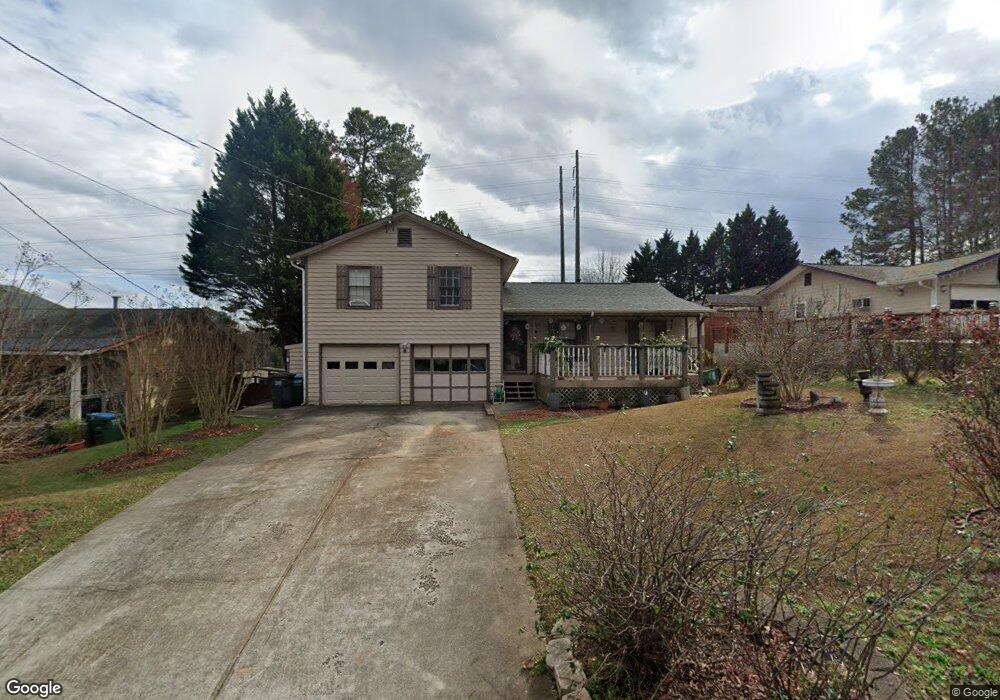
2373 E Hill Way Norcross, GA 30071
Estimated Value: $317,000 - $347,000
3
Beds
2
Baths
1,728
Sq Ft
$194/Sq Ft
Est. Value
About This Home
This home is located at 2373 E Hill Way, Norcross, GA 30071 and is currently estimated at $335,705, approximately $194 per square foot. 2373 E Hill Way is a home located in Gwinnett County with nearby schools including Norcross Elementary School, Summerour Middle School, and Norcross High School.
Ownership History
Date
Name
Owned For
Owner Type
Purchase Details
Closed on
Feb 27, 2020
Sold by
Le Trang C
Bought by
Le Cam Trang T and Tran Dung Hoang
Current Estimated Value
Purchase Details
Closed on
Jul 2, 2009
Sold by
Ameriquest Mtg Series 2005-R1
Bought by
Le Trang C and Le Trang Hung T
Home Financials for this Owner
Home Financials are based on the most recent Mortgage that was taken out on this home.
Original Mortgage
$71,677
Interest Rate
4.88%
Mortgage Type
FHA
Purchase Details
Closed on
Feb 4, 2009
Sold by
Resendiz Isidro and Resendiz Martha
Bought by
Ameriquest Mtg Series 2005-R1
Purchase Details
Closed on
Dec 4, 2000
Sold by
Conklin George E and Conklin Alice M
Bought by
Resendiz Isidoro and Resendiz Martha
Home Financials for this Owner
Home Financials are based on the most recent Mortgage that was taken out on this home.
Original Mortgage
$126,885
Interest Rate
7.71%
Mortgage Type
FHA
Create a Home Valuation Report for This Property
The Home Valuation Report is an in-depth analysis detailing your home's value as well as a comparison with similar homes in the area
Home Values in the Area
Average Home Value in this Area
Purchase History
| Date | Buyer | Sale Price | Title Company |
|---|---|---|---|
| Le Cam Trang T | -- | -- | |
| Le Trang C | $73,000 | -- | |
| Ameriquest Mtg Series 2005-R1 | $121,500 | -- | |
| Resendiz Isidoro | $130,900 | -- |
Source: Public Records
Mortgage History
| Date | Status | Borrower | Loan Amount |
|---|---|---|---|
| Previous Owner | Le Trang C | $71,677 | |
| Previous Owner | Resendiz Isidoro | $126,885 |
Source: Public Records
Tax History Compared to Growth
Tax History
| Year | Tax Paid | Tax Assessment Tax Assessment Total Assessment is a certain percentage of the fair market value that is determined by local assessors to be the total taxable value of land and additions on the property. | Land | Improvement |
|---|---|---|---|---|
| 2025 | -- | $148,440 | $25,840 | $122,600 |
| 2024 | $4,869 | $127,160 | $25,600 | $101,560 |
| 2023 | $4,869 | $127,160 | $25,600 | $101,560 |
| 2022 | $4,475 | $117,680 | $23,200 | $94,480 |
| 2021 | $3,234 | $81,440 | $18,400 | $63,040 |
| 2020 | $2,578 | $78,240 | $16,000 | $62,240 |
| 2019 | $2,512 | $78,240 | $16,000 | $62,240 |
| 2018 | $2,250 | $66,200 | $13,600 | $52,600 |
| 2016 | $1,903 | $51,720 | $11,200 | $40,520 |
| 2015 | $1,503 | $39,880 | $8,000 | $31,880 |
| 2014 | -- | $33,640 | $8,000 | $25,640 |
Source: Public Records
Map
Nearby Homes
- 2325 E Hill Way NW
- 4242 Morrison Lake Trail
- 5106 Rockborough Trail
- 4935 Rockborough Trail
- 5065 Rockborough Trail NW
- 5041 Rockborough Trail Unit 3
- 2621 Bailey Dr
- 5045 Racquet Ct
- 2340 Beaver Ruin Rd Unit 26
- 2340 Beaver Ruin Rd Unit 4
- 2340 Beaver Ruin Rd Unit 41
- 2340 Beaver Ruin Rd
- 2340 Beaver Ruin Rd Unit 15
- 2340 Beaver Ruin Rd Unit 16
- 5055 Running Fox Trail
- 5206 Westhill Dr NW
- 4981 Sharp Way
- 4960 Racquet Ct
- 2318 Ingram Rd
- 4767 Glenwhite Dr
- 2373 East Hill Way
- 2365 East Hill Way Unit 4
- 2381 East Hill Way
- 2381 E Hill Way
- 2357 East Hill Way
- 2357 E Hill Way
- 2389 East Hill Way Unit 4
- 2374 E Hill Way
- 2374 East Hill Way Unit 4
- 2366 East Hill Way Unit 4
- 2349 E Hill Way
- 2349 East Hill Way
- 2397 East Hill Way
- 2397 E Hill Way
- 2382 E Hill Way
- 2382 East Hill Way Unit 4
- 4354 Sunny Oak Ln
- 4210 Sunny Oak Ln
- 4271 Sunny Oak Ln
- 4424 Sunny Oak Ln