Estimated Value: $707,000 - $967,653
3
Beds
2
Baths
2,724
Sq Ft
$298/Sq Ft
Est. Value
About This Home
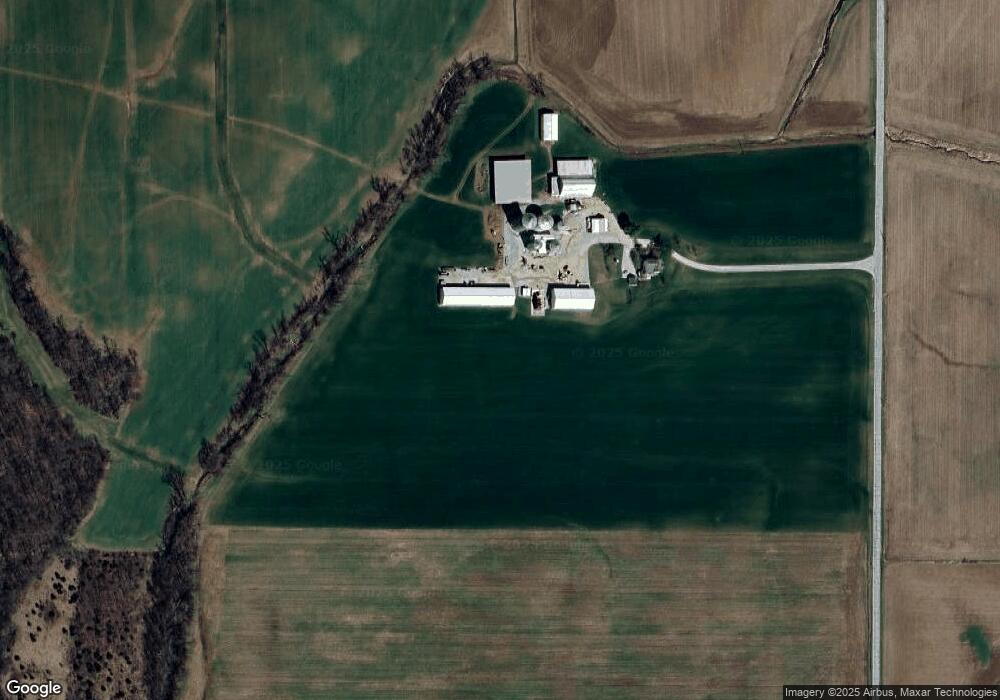
This home is located at 2373 Wyatt Rd, Eaton, OH 45320 and is currently estimated at $811,551, approximately $297 per square foot. 2373 Wyatt Rd is a home located in Preble County with nearby schools including Hollingsworth East Elementary School, William Bruce Elementary School, and Eaton Middle School.
Ownership History
Date
Name
Owned For
Owner Type
Purchase Details
Closed on
Feb 3, 2012
Sold by
Earley Dirk E
Bought by
Bowman Robert O and Bowman Carrie L
Current Estimated Value
Home Financials for this Owner
Home Financials are based on the most recent Mortgage that was taken out on this home.
Original Mortgage
$878,780
Outstanding Balance
$359,101
Interest Rate
3.9%
Mortgage Type
Purchase Money Mortgage
Estimated Equity
$452,450
Purchase Details
Closed on
Dec 6, 2007
Sold by
Bowman Eric E and Bowman Darla R
Bought by
Bowman Robert O and Bowman Carrie L
Purchase Details
Closed on
May 24, 2001
Sold by
Trst John F Pierce
Bought by
Bowman Robert O and Bowman Carrie L
Home Financials for this Owner
Home Financials are based on the most recent Mortgage that was taken out on this home.
Original Mortgage
$275,000
Interest Rate
7.99%
Mortgage Type
New Conventional
Create a Home Valuation Report for This Property
The Home Valuation Report is an in-depth analysis detailing your home's value as well as a comparison with similar homes in the area
Home Values in the Area
Average Home Value in this Area
Purchase History
| Date | Buyer | Sale Price | Title Company |
|---|---|---|---|
| Bowman Robert O | -- | Attorney | |
| Bowman Robert O | -- | Attorney | |
| Bowman Robert O | $322,500 | -- |
Source: Public Records
Mortgage History
| Date | Status | Borrower | Loan Amount |
|---|---|---|---|
| Open | Bowman Robert O | $878,780 | |
| Previous Owner | Bowman Robert O | $275,000 |
Source: Public Records
Tax History Compared to Growth
Tax History
| Year | Tax Paid | Tax Assessment Tax Assessment Total Assessment is a certain percentage of the fair market value that is determined by local assessors to be the total taxable value of land and additions on the property. | Land | Improvement |
|---|---|---|---|---|
| 2024 | $5,699 | $265,260 | $164,840 | $100,420 |
| 2023 | $5,699 | $265,260 | $164,840 | $100,420 |
| 2022 | $3,927 | $91,110 | $32,800 | $58,310 |
| 2021 | $4,124 | $194,860 | $136,550 | $58,310 |
| 2020 | $3,968 | $194,860 | $136,550 | $58,310 |
| 2019 | $4,750 | $187,030 | $130,050 | $56,980 |
| 2018 | $4,903 | $187,030 | $130,050 | $56,980 |
| 2017 | $4,836 | $187,030 | $130,050 | $56,980 |
| 2016 | $4,771 | $146,190 | $109,650 | $36,540 |
| 2014 | $4,690 | $146,200 | $109,660 | $36,540 |
| 2013 | $2,996 | $123,165 | $86,625 | $36,540 |
Source: Public Records
Map
Nearby Homes