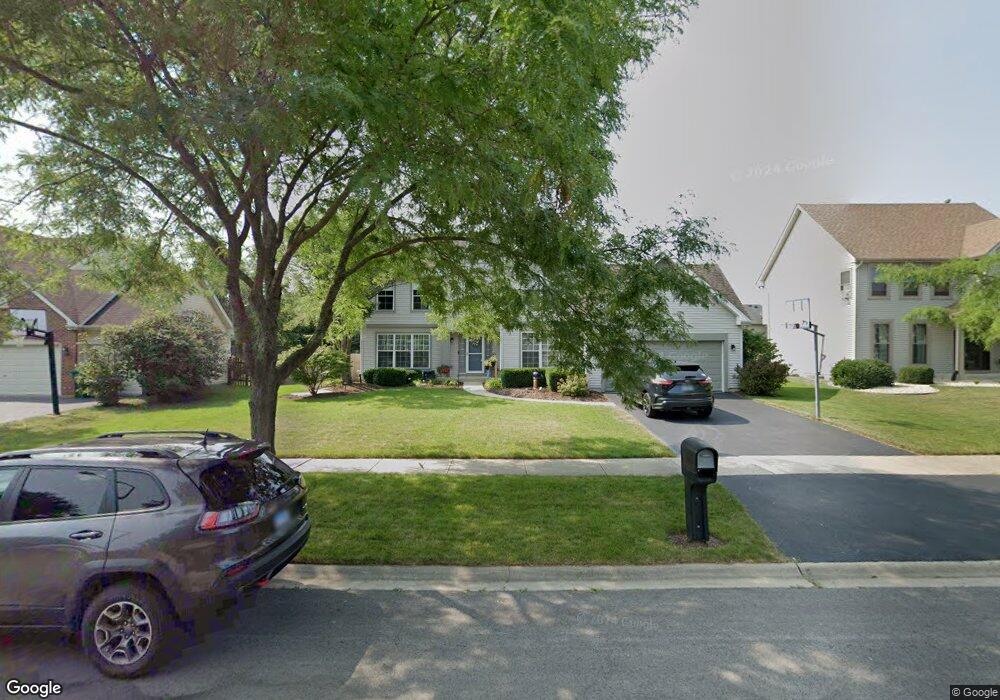
23731 Greenfield Dr Unit 2 Plainfield, IL 60585
North Plainfield NeighborhoodEstimated Value: $491,597 - $575,000
Studio
1
Bath
2,667
Sq Ft
$197/Sq Ft
Est. Value
About This Home
This home is located at 23731 Greenfield Dr Unit 2, Plainfield, IL 60585 and is currently estimated at $524,399, approximately $196 per square foot. 23731 Greenfield Dr Unit 2 is a home located in Will County with nearby schools including Liberty Elementary School, John F Kennedy Middle School, and Plainfield East High School.
Ownership History
Date
Name
Owned For
Owner Type
Purchase Details
Closed on
Sep 30, 2013
Sold by
Wierzba Michael F and Wierzba Judy L
Bought by
Wierzba Michael F and Wierzba Judy L
Current Estimated Value
Purchase Details
Closed on
Apr 29, 2002
Sold by
Khan Farrukh and Meraj Sayyada
Bought by
Wierzba Michael F and Wierzba Judy L
Home Financials for this Owner
Home Financials are based on the most recent Mortgage that was taken out on this home.
Original Mortgage
$188,300
Outstanding Balance
$80,908
Interest Rate
7.18%
Estimated Equity
$443,491
Purchase Details
Closed on
Jun 8, 2000
Sold by
The Old Second National Bank Of Aurora
Bought by
Khan Farrukh and Meraj Sayyada
Home Financials for this Owner
Home Financials are based on the most recent Mortgage that was taken out on this home.
Original Mortgage
$176,863
Interest Rate
8.87%
Create a Home Valuation Report for This Property
The Home Valuation Report is an in-depth analysis detailing your home's value as well as a comparison with similar homes in the area
Home Values in the Area
Average Home Value in this Area
Purchase History
| Date | Buyer | Sale Price | Title Company |
|---|---|---|---|
| Wierzba Michael F | -- | None Available | |
| Wierzba Michael F | $269,000 | First American Title | |
| Khan Farrukh | $221,500 | -- |
Source: Public Records
Mortgage History
| Date | Status | Borrower | Loan Amount |
|---|---|---|---|
| Open | Wierzba Michael F | $188,300 | |
| Previous Owner | Khan Farrukh | $176,863 |
Source: Public Records
Tax History
| Year | Tax Paid | Tax Assessment Tax Assessment Total Assessment is a certain percentage of the fair market value that is determined by local assessors to be the total taxable value of land and additions on the property. | Land | Improvement |
|---|---|---|---|---|
| 2024 | $10,273 | $149,159 | $42,795 | $106,364 |
| 2023 | $10,273 | $131,766 | $37,805 | $93,961 |
| 2022 | $8,913 | $117,220 | $35,764 | $81,456 |
| 2021 | $8,582 | $111,638 | $34,061 | $77,577 |
| 2020 | $8,575 | $109,869 | $33,521 | $76,348 |
| 2019 | $8,445 | $106,772 | $32,576 | $74,196 |
| 2018 | $8,515 | $105,576 | $31,858 | $73,718 |
| 2017 | $8,471 | $102,851 | $31,036 | $71,815 |
| 2016 | $8,490 | $100,637 | $30,368 | $70,269 |
| 2015 | $7,541 | $96,766 | $29,200 | $67,566 |
| 2014 | $7,541 | $86,990 | $29,200 | $57,790 |
| 2013 | $7,541 | $86,990 | $29,200 | $57,790 |
Source: Public Records
Map
Nearby Homes
- 13142 Cathy Ln
- 13360 Vicky St
- 12746 S Kerry Ln
- 12629 S Potomac Dr
- 12740 S Kerry Ln
- 12929 S Platte Trail
- 12939 S Platte Trail
- 23308 W Tenny St
- 12928 S Kerry Ln
- 23250 W Tenny St
- 23253 W Tenny St
- 23242 W Tenny St
- 23236 W Teton Ln
- 12937 S Kerry Ln
- 23236 W Tenny St
- 12920 S Slate Ln
- 23244 W Teton Ln
- 23224 W Teton Ln
- 12916 S Slate Ln
- 23231 W Tenny St
- 23741 Greenfield Dr
- 23746 Tall Grass Dr
- 23736 Tall Grass Dr
- 23756 Tall Grass Dr Unit 2
- 23751 Greenfield Dr
- 23711 Greenfield Dr
- 23726 Tall Grass Dr
- 23736 Greenfield Dr
- 23746 Greenfield Dr
- 23766 Tall Grass Dr
- 23861 Greenfield Dr Unit 2
- 23726 Greenfield Dr
- 23756 Greenfield Dr Unit 2
- 12940 Denise St
- 23806 Tall Grass Dr
- 12936 Denise St
- 23716 Greenfield Dr
- 23866 Greenfield Dr Unit 2
- 23741 Tall Grass Dr
- 23731 Tall Grass Dr
Your Personal Tour Guide
Ask me questions while you tour the home.