2374 S Williams St Denver, CO 80210
University NeighborhoodEstimated Value: $509,154 - $648,000
2
Beds
1
Bath
780
Sq Ft
$724/Sq Ft
Est. Value
About This Home
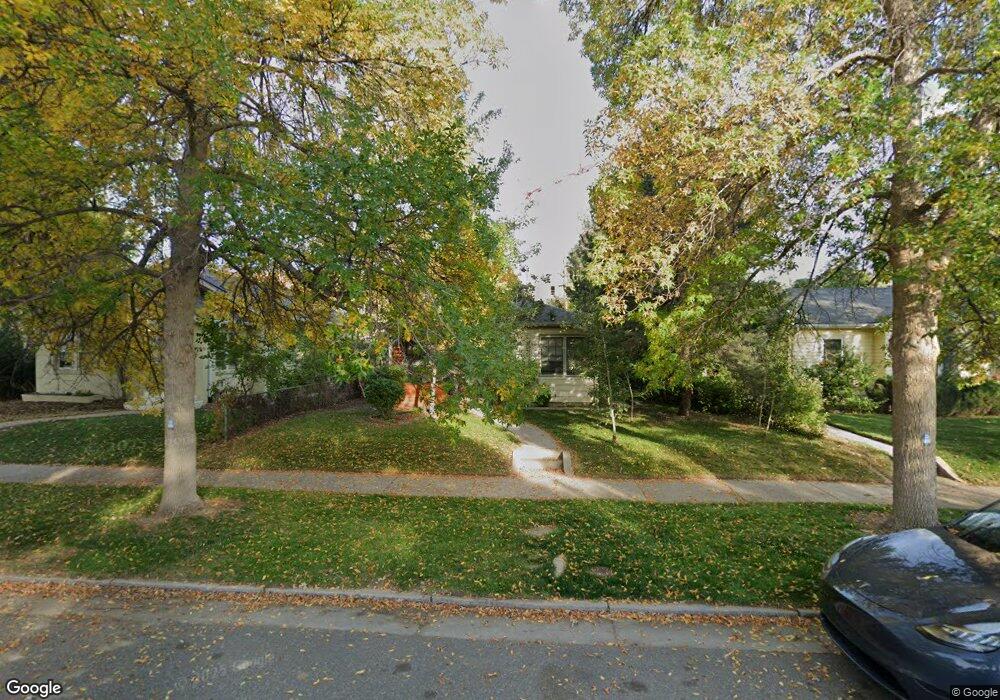
This home is located at 2374 S Williams St, Denver, CO 80210 and is currently estimated at $564,539, approximately $723 per square foot. 2374 S Williams St is a home located in Denver County with nearby schools including Asbury Elementary School, Grant Beacon Middle School, and South High School.
Ownership History
Date
Name
Owned For
Owner Type
Purchase Details
Closed on
Sep 28, 2015
Sold by
Pedersen Michael Dallas
Bought by
Jaeger Mariah and Gillaspie Mark
Current Estimated Value
Home Financials for this Owner
Home Financials are based on the most recent Mortgage that was taken out on this home.
Original Mortgage
$287,000
Outstanding Balance
$224,020
Interest Rate
3.97%
Mortgage Type
Purchase Money Mortgage
Estimated Equity
$340,519
Purchase Details
Closed on
Aug 2, 2007
Sold by
Malerbi Michael D
Bought by
Pedersen Michael Dallas
Home Financials for this Owner
Home Financials are based on the most recent Mortgage that was taken out on this home.
Original Mortgage
$195,500
Interest Rate
6.69%
Mortgage Type
Purchase Money Mortgage
Purchase Details
Closed on
Feb 22, 2000
Sold by
Coles David H
Bought by
Malerbi Michael D
Home Financials for this Owner
Home Financials are based on the most recent Mortgage that was taken out on this home.
Original Mortgage
$157,140
Interest Rate
8.19%
Create a Home Valuation Report for This Property
The Home Valuation Report is an in-depth analysis detailing your home's value as well as a comparison with similar homes in the area
Home Values in the Area
Average Home Value in this Area
Purchase History
| Date | Buyer | Sale Price | Title Company |
|---|---|---|---|
| Jaeger Mariah | $349,000 | First American | |
| Pedersen Michael Dallas | -- | Land Title Guarantee Company | |
| Malerbi Michael D | $162,450 | Land Title |
Source: Public Records
Mortgage History
| Date | Status | Borrower | Loan Amount |
|---|---|---|---|
| Open | Jaeger Mariah | $287,000 | |
| Previous Owner | Pedersen Michael Dallas | $195,500 | |
| Previous Owner | Malerbi Michael D | $157,140 |
Source: Public Records
Tax History
| Year | Tax Paid | Tax Assessment Tax Assessment Total Assessment is a certain percentage of the fair market value that is determined by local assessors to be the total taxable value of land and additions on the property. | Land | Improvement |
|---|---|---|---|---|
| 2025 | $2,736 | $36,170 | $36,100 | $36,100 |
| 2024 | $2,736 | $34,540 | $28,720 | $5,820 |
| 2023 | $2,676 | $34,540 | $28,720 | $5,820 |
| 2022 | $2,228 | $28,010 | $23,730 | $4,280 |
| 2021 | $2,150 | $28,810 | $24,410 | $4,400 |
| 2020 | $2,234 | $30,110 | $19,330 | $10,780 |
| 2019 | $2,171 | $30,110 | $19,330 | $10,780 |
| 2018 | $2,059 | $26,610 | $18,440 | $8,170 |
| 2017 | $2,053 | $26,610 | $18,440 | $8,170 |
| 2016 | $1,620 | $19,870 | $16,987 | $2,883 |
| 2015 | $1,420 | $18,170 | $16,987 | $1,183 |
| 2014 | $1,458 | $17,550 | $13,588 | $3,962 |
Source: Public Records
Map
Nearby Homes
- 2389 S High St Unit 4
- 2349 S High St
- 2347 S High St
- 2345 S High St
- 2341 S High St
- 2343 S High St
- 2338 S Williams St
- 2323 S High St
- 2345 S Williams St
- 2444 S Williams St
- 2427 S Race St
- 2443 S Williams St
- 2301 S High St
- 2485 S High St
- 2245 S High St
- 2401 S Gaylord St Unit 206
- 2558 S Vine St
- 2628 S High St
- 2419 S Lafayette St
- 2409 S Lafayette St
- 2368 S Williams St
- 2382 S Williams St
- 2360 S Williams St
- 2388 S Williams St
- 2350 S Williams St
- 2383 S Williams St
- 2369 S Williams St
- 2361 S Williams St
- 2375 S Williams St
- 2379 S High St
- 2387 S Williams St
- 2361 S High St
- 2344 S Williams St
- 2353 S Williams St
- 2357 S High St
- 2389 S High St Unit 5
- 2389 S High St Unit 3
- 2389 S High St Unit 2
- 2389 S High St Unit 1
- 2389 S High St
Your Personal Tour Guide
Ask me questions while you tour the home.