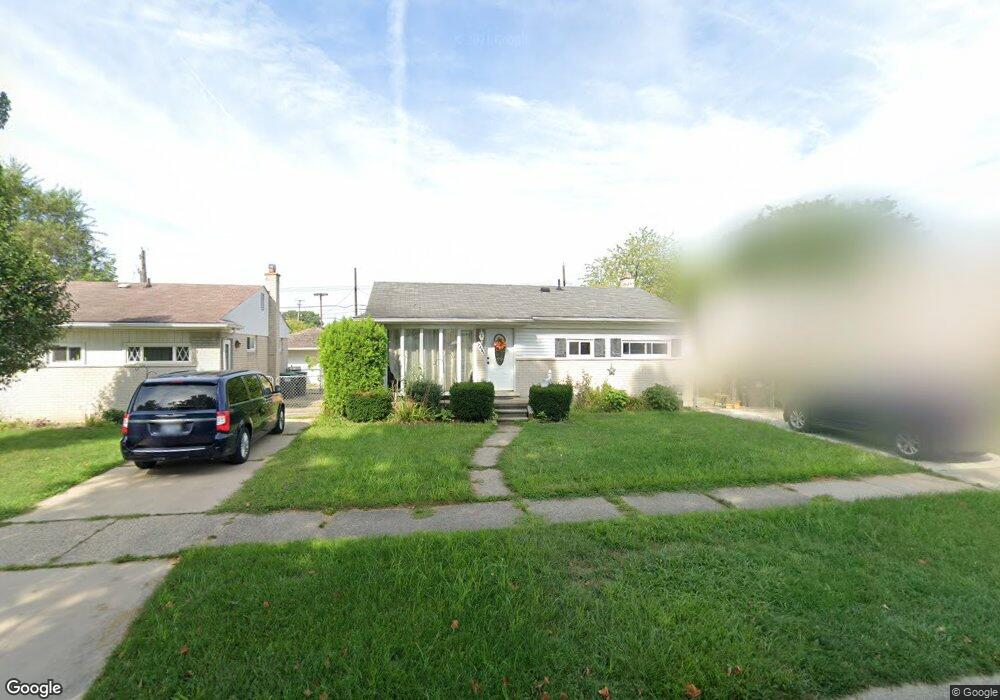
23741 Irving St Taylor, MI 48180
Estimated Value: $177,000 - $227,000
3
Beds
1
Bath
1,015
Sq Ft
$197/Sq Ft
Est. Value
About This Home
This home is located at 23741 Irving St, Taylor, MI 48180 and is currently estimated at $200,328, approximately $197 per square foot. 23741 Irving St is a home located in Wayne County with nearby schools including Clarence Randall Elementary School, Robert J. West Middle School, and Taylor High School.
Ownership History
Date
Name
Owned For
Owner Type
Purchase Details
Closed on
Oct 20, 2016
Sold by
Copley Ralph and Copley Jennifer Christine
Bought by
Coffey Joshua M
Current Estimated Value
Home Financials for this Owner
Home Financials are based on the most recent Mortgage that was taken out on this home.
Original Mortgage
$5,614
Outstanding Balance
$4,504
Interest Rate
3.48%
Mortgage Type
Purchase Money Mortgage
Estimated Equity
$195,824
Purchase Details
Closed on
Sep 7, 2011
Sold by
Secretary Of Housing & Urban Development
Bought by
Copley Ralph
Purchase Details
Closed on
Aug 23, 2010
Sold by
Citimortgage Inc
Bought by
Secretary Of Housing & Urban Development
Purchase Details
Closed on
May 12, 2010
Sold by
Betzing Earl E and Betzing Phyllis J
Bought by
Citimortgage Inc
Purchase Details
Closed on
Oct 31, 2001
Sold by
Wallace Earl M
Bought by
Betzing Earl E
Create a Home Valuation Report for This Property
The Home Valuation Report is an in-depth analysis detailing your home's value as well as a comparison with similar homes in the area
Home Values in the Area
Average Home Value in this Area
Purchase History
| Date | Buyer | Sale Price | Title Company |
|---|---|---|---|
| Coffey Joshua M | $77,500 | Leading Edge Title Agency | |
| Copley Ralph | $36,200 | None Available | |
| Secretary Of Housing & Urban Development | -- | None Available | |
| Citimortgage Inc | $142,161 | None Available | |
| Betzing Earl E | $120,000 | -- |
Source: Public Records
Mortgage History
| Date | Status | Borrower | Loan Amount |
|---|---|---|---|
| Open | Coffey Joshua M | $5,614 |
Source: Public Records
Tax History
| Year | Tax Paid | Tax Assessment Tax Assessment Total Assessment is a certain percentage of the fair market value that is determined by local assessors to be the total taxable value of land and additions on the property. | Land | Improvement |
|---|---|---|---|---|
| 2025 | $2,000 | $98,700 | $0 | $0 |
| 2024 | $1,937 | $89,200 | $0 | $0 |
| 2023 | $1,788 | $78,100 | $0 | $0 |
| 2022 | $1,788 | $68,100 | $0 | $0 |
| 2021 | $1,969 | $61,400 | $0 | $0 |
| 2020 | $1,949 | $53,000 | $0 | $0 |
| 2019 | $194,769 | $45,100 | $0 | $0 |
| 2018 | $1,535 | $37,400 | $0 | $0 |
| 2017 | $832 | $35,100 | $0 | $0 |
| 2016 | $1,866 | $34,100 | $0 | $0 |
| 2015 | $3,444 | $35,500 | $0 | $0 |
| 2013 | $3,430 | $35,000 | $0 | $0 |
| 2012 | $1,507 | $34,600 | $10,600 | $24,000 |
Source: Public Records
Map
Nearby Homes
- 23751 Irving St
- 23731 Irving St
- 23761 Irving St
- 23721 Irving St
- 23771 Irving St
- 23711 Irving St
- 8715 Telegraph Rd Unit Bldg-Unit
- 8715 Telegraph Rd
- 23744 Irving St
- 23730 Irving St
- 23754 Irving St
- 23712 Irving St
- 23781 Irving St
- 23764 Irving St
- 23701 Irving St
- 23702 Irving St
- 23725 Filmore St
- 23699 Irving St
- 23715 Filmore St
- 23698 Irving St
Your Personal Tour Guide
Ask me questions while you tour the home.