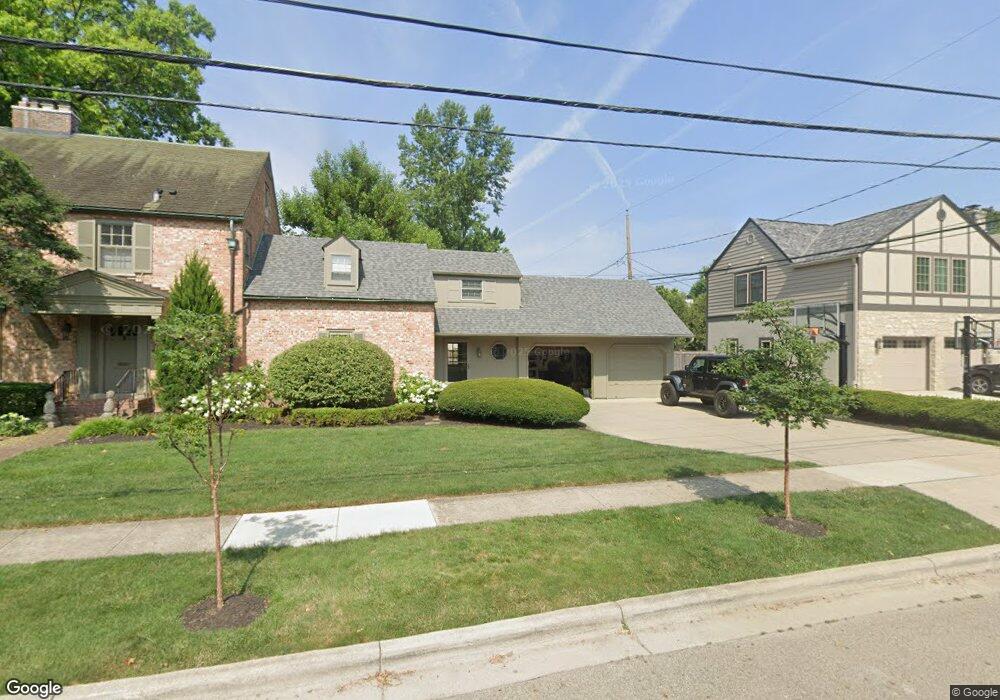
2375 Andover Rd Columbus, OH 43221
Estimated Value: $1,143,184 - $1,286,000
4
Beds
5
Baths
2,783
Sq Ft
$436/Sq Ft
Est. Value
About This Home
This home is located at 2375 Andover Rd, Columbus, OH 43221 and is currently estimated at $1,213,046, approximately $435 per square foot. 2375 Andover Rd is a home located in Franklin County with nearby schools including Barrington Road Elementary School, Jones Middle School, and Upper Arlington High School.
Ownership History
Date
Name
Owned For
Owner Type
Purchase Details
Closed on
Sep 14, 2007
Sold by
Res Jones Rose M and Res Rose M Jones 2000 Personal
Bought by
Corna Joshua D and Corna Amy E
Current Estimated Value
Home Financials for this Owner
Home Financials are based on the most recent Mortgage that was taken out on this home.
Original Mortgage
$380,000
Outstanding Balance
$237,259
Interest Rate
6.66%
Mortgage Type
Purchase Money Mortgage
Estimated Equity
$975,787
Purchase Details
Closed on
Apr 12, 2000
Sold by
Jones Rose M
Bought by
Res Jones Rose M and Res Rose M Jones 2000 Personal
Purchase Details
Closed on
May 7, 1999
Sold by
Christensen William J and Christensen Laura M
Bought by
Jones Rose M
Purchase Details
Closed on
Dec 15, 1994
Sold by
Larrimer Gavin R
Bought by
Christensen William J and Christensen Laura M
Create a Home Valuation Report for This Property
The Home Valuation Report is an in-depth analysis detailing your home's value as well as a comparison with similar homes in the area
Home Values in the Area
Average Home Value in this Area
Purchase History
| Date | Buyer | Sale Price | Title Company |
|---|---|---|---|
| Corna Joshua D | $659,300 | Talon Group | |
| Res Jones Rose M | -- | -- | |
| Jones Rose M | $415,000 | Chicago Title | |
| Christensen William J | $395,000 | -- |
Source: Public Records
Mortgage History
| Date | Status | Borrower | Loan Amount |
|---|---|---|---|
| Open | Corna Joshua D | $380,000 |
Source: Public Records
Tax History
| Year | Tax Paid | Tax Assessment Tax Assessment Total Assessment is a certain percentage of the fair market value that is determined by local assessors to be the total taxable value of land and additions on the property. | Land | Improvement |
|---|---|---|---|---|
| 2025 | $19,462 | $336,180 | $129,960 | $206,220 |
| 2024 | $19,462 | $336,180 | $129,960 | $206,220 |
| 2023 | $19,221 | $336,180 | $129,960 | $206,220 |
| 2022 | $18,448 | $264,010 | $79,380 | $184,630 |
| 2021 | $16,331 | $264,010 | $79,380 | $184,630 |
| 2020 | $16,186 | $264,010 | $79,380 | $184,630 |
| 2019 | $16,094 | $232,090 | $79,380 | $152,710 |
| 2018 | $15,121 | $232,090 | $79,380 | $152,710 |
| 2017 | $15,160 | $232,090 | $79,380 | $152,710 |
| 2016 | $14,251 | $214,030 | $74,170 | $139,860 |
| 2015 | $14,239 | $214,030 | $74,170 | $139,860 |
| 2014 | $14,156 | $214,030 | $74,170 | $139,860 |
| 2013 | $6,809 | $194,565 | $67,410 | $127,155 |
Source: Public Records
Map
Nearby Homes
- 1869 Tewksbury Rd
- 2583 Wexford Rd
- 2167 Fairfax Rd
- 1565 Berkshire Rd
- 2748 Tremont Rd
- 1621 Waltham Rd Unit B
- 2727 Westmont Blvd
- 2000 Northwest Blvd Unit D
- 1960 Hillside Dr
- 1810 Ashland Ave
- 2026 Jervis Rd
- 1835 Northwest Ct Unit 141
- 1785 Northwest Ct Unit D
- 2031 Concord Rd
- 3106 Somerford Rd
- 1799 Kings Ct Unit B
- 2979 Avalon Rd
- 2329 Keep Place Unit 2329
- 2015 W 5th Ave Unit 211
- 2015 W 5th Ave Unit 102
- 1914 Chatfield Rd
- 2376 Andover Rd
- 2395 Andover Rd
- 1905 Berkshire Rd
- 2355 Andover Rd
- 1880 Chatfield Rd
- 2396 Andover Rd
- 1926 Chatfield Rd
- 1915 Berkshire Rd
- 1923 Chatfield Rd
- 2350 Andover Rd
- 1873 Berkshire Rd
- 1923 Berkshire Rd
- 1874 Chatfield Rd
- 1936 Chatfield Rd
- 1920 Beverly Rd
- 1933 Chatfield Rd
- 1879 Chatfield Rd
- 1867 Berkshire Rd
- 1931 Berkshire Rd