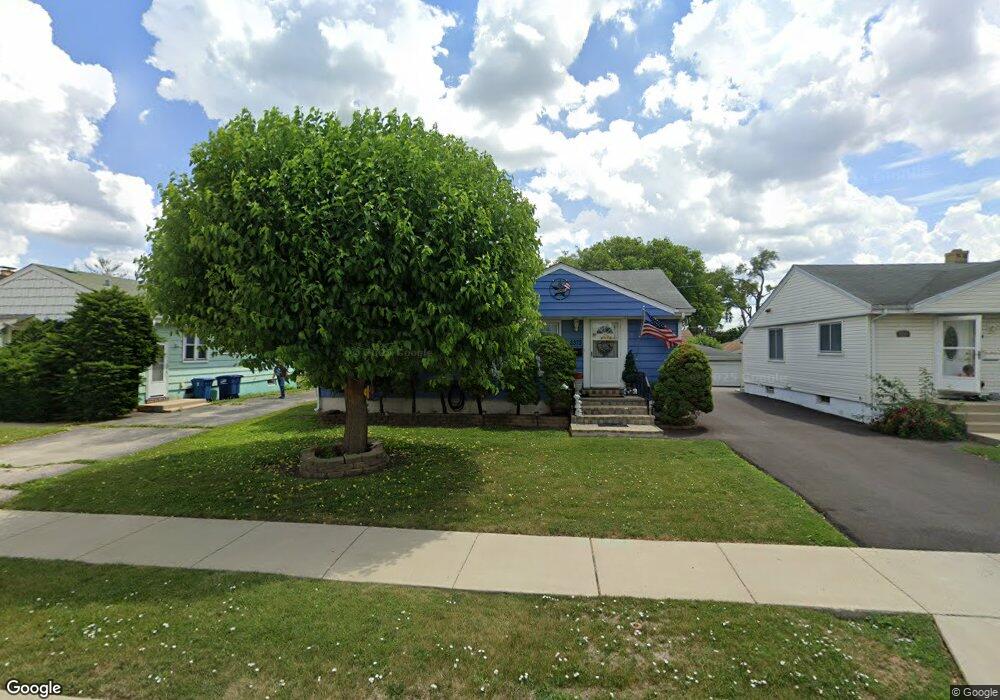
2375 S Scott St Des Plaines, IL 60018
Estimated Value: $346,760 - $398,000
3
Beds
1
Bath
1,257
Sq Ft
$297/Sq Ft
Est. Value
About This Home
This home is located at 2375 S Scott St, Des Plaines, IL 60018 and is currently estimated at $373,940, approximately $297 per square foot. 2375 S Scott St is a home located in Cook County with nearby schools including South Elementary School, Algonquin Middle School, and Maine West High School.
Ownership History
Date
Name
Owned For
Owner Type
Purchase Details
Closed on
Oct 18, 2006
Sold by
Waller Frank R and Lazo Marina Del Carmen
Bought by
Waller Frank R and Waller Marina Del Carmen
Current Estimated Value
Home Financials for this Owner
Home Financials are based on the most recent Mortgage that was taken out on this home.
Original Mortgage
$250,000
Outstanding Balance
$146,360
Interest Rate
6.4%
Mortgage Type
New Conventional
Estimated Equity
$227,580
Purchase Details
Closed on
Apr 29, 1999
Sold by
Arreguin Alfredo A and Arreguin Irma C
Bought by
Waller Frank R and Waller Barbara
Home Financials for this Owner
Home Financials are based on the most recent Mortgage that was taken out on this home.
Original Mortgage
$144,019
Interest Rate
7.04%
Mortgage Type
FHA
Purchase Details
Closed on
Jun 29, 1994
Sold by
Villapando Ramon and Villapando Isabel
Bought by
Arrequin Alfredo A and Arrequin Irma C
Home Financials for this Owner
Home Financials are based on the most recent Mortgage that was taken out on this home.
Original Mortgage
$142,127
Interest Rate
8.61%
Mortgage Type
FHA
Create a Home Valuation Report for This Property
The Home Valuation Report is an in-depth analysis detailing your home's value as well as a comparison with similar homes in the area
Home Values in the Area
Average Home Value in this Area
Purchase History
| Date | Buyer | Sale Price | Title Company |
|---|---|---|---|
| Waller Frank R | -- | First American Title Ins Co | |
| Waller Frank R | $145,000 | Chicago Title Insurance Co | |
| Arrequin Alfredo A | $145,000 | -- |
Source: Public Records
Mortgage History
| Date | Status | Borrower | Loan Amount |
|---|---|---|---|
| Open | Waller Frank R | $250,000 | |
| Closed | Waller Frank R | $144,019 | |
| Previous Owner | Arrequin Alfredo A | $142,127 |
Source: Public Records
Tax History
| Year | Tax Paid | Tax Assessment Tax Assessment Total Assessment is a certain percentage of the fair market value that is determined by local assessors to be the total taxable value of land and additions on the property. | Land | Improvement |
|---|---|---|---|---|
| 2025 | $5,717 | $29,000 | $4,356 | $24,644 |
| 2024 | $5,717 | $25,000 | $3,630 | $21,370 |
| 2023 | $5,553 | $25,000 | $3,630 | $21,370 |
| 2022 | $5,553 | $25,000 | $3,630 | $21,370 |
| 2021 | $4,287 | $17,276 | $3,025 | $14,251 |
| 2020 | $4,283 | $17,276 | $3,025 | $14,251 |
| 2019 | $4,301 | $19,412 | $3,025 | $16,387 |
| 2018 | $4,637 | $18,940 | $2,662 | $16,278 |
| 2017 | $4,573 | $18,940 | $2,662 | $16,278 |
| 2016 | $5,016 | $20,547 | $2,662 | $17,885 |
| 2015 | $5,063 | $19,370 | $2,299 | $17,071 |
| 2014 | $4,972 | $19,370 | $2,299 | $17,071 |
| 2013 | $4,831 | $19,370 | $2,299 | $17,071 |
Source: Public Records
Map
Nearby Homes
- 1939 E Touhy Ave
- 38 E Touhy Ave
- 2469 Parkwood Ln
- 2600 S Scott St
- 2609 Eisenhower Dr
- 2646 Maple St
- 1641 E Touhy Ave
- 1629 E Touhy Ave
- 1757 Farwell Ave
- 2124 Halsey Dr
- 1721 Prospect Ave
- 2945 S Scott St
- 22 Park Ln Unit 203
- 22 Park Ln Unit 220
- 200 Thames Pkwy Unit 1
- 2220 S Chestnut St
- 300 Boardwalk Place Unit T300
- 3051 S Scott St
- 201 Thames Pkwy Unit 2F
- 201 Thames Pkwy Unit 2K
- 2369 S Scott St
- 2383 S Scott St
- 2355 S Scott St
- 2004 E Touhy Ave
- 2376 Magnolia St
- 2370 Magnolia St
- 2347 S Scott St
- 2364 Magnolia St
- 2040 E Touhy Ave
- 2374 S Scott St
- 2362 S Scott St
- 2382 S Scott St
- 2356 Magnolia St
- 2337 S Scott St
- 2356 S Scott St
- 1988 E Touhy Ave
- 2346 S Scott St
- 2342 Magnolia St
- 2333 S Scott St
- 2451 Magnolia St
Your Personal Tour Guide
Ask me questions while you tour the home.