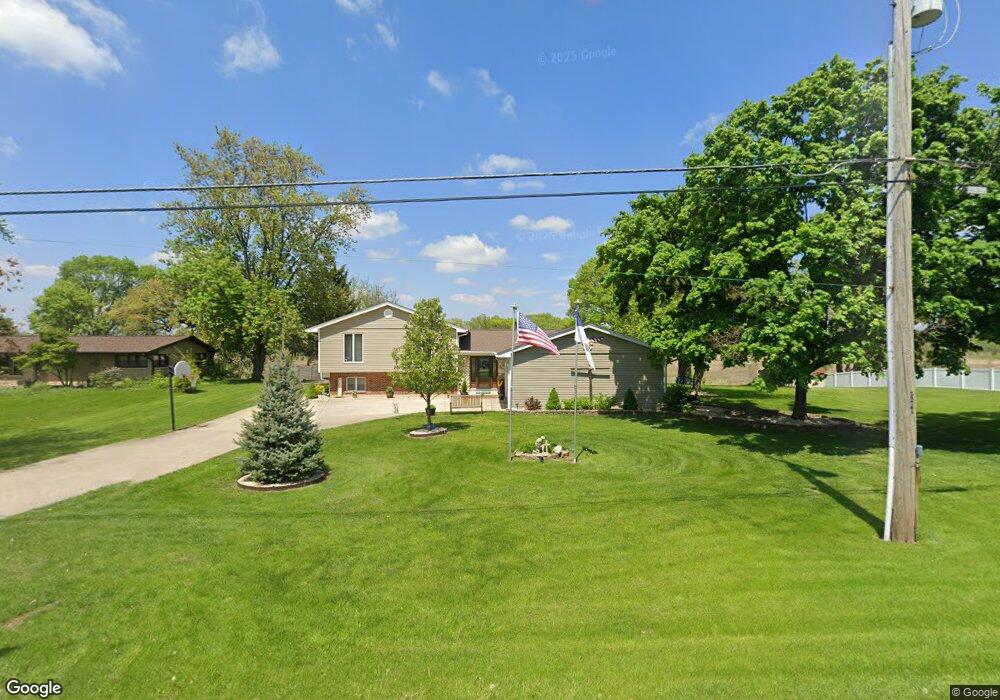
23764 W Mcclintock Rd Channahon, IL 60410
Southwest Joliet NeighborhoodEstimated Value: $297,083 - $337,000
--
Bed
1
Bath
2,088
Sq Ft
$153/Sq Ft
Est. Value
About This Home
This home is located at 23764 W Mcclintock Rd, Channahon, IL 60410 and is currently estimated at $319,021, approximately $152 per square foot. 23764 W Mcclintock Rd is a home located in Will County with nearby schools including Heritage Trail Elementary School, Troy Middle School, and Orenic Intermediate School.
Ownership History
Date
Name
Owned For
Owner Type
Purchase Details
Closed on
Oct 18, 1996
Sold by
Hagberg Jeffery O and Hagberg Monica L
Bought by
Carr John R and Carr Gail J
Current Estimated Value
Home Financials for this Owner
Home Financials are based on the most recent Mortgage that was taken out on this home.
Original Mortgage
$133,200
Outstanding Balance
$12,480
Interest Rate
8.32%
Estimated Equity
$306,541
Purchase Details
Closed on
Aug 11, 1995
Sold by
Ennis Orie L and Ennis Nancy C
Bought by
Hagberg Jeffrey O and Hagberg Monica L
Home Financials for this Owner
Home Financials are based on the most recent Mortgage that was taken out on this home.
Original Mortgage
$105,000
Interest Rate
7.91%
Mortgage Type
Seller Take Back
Create a Home Valuation Report for This Property
The Home Valuation Report is an in-depth analysis detailing your home's value as well as a comparison with similar homes in the area
Home Values in the Area
Average Home Value in this Area
Purchase History
| Date | Buyer | Sale Price | Title Company |
|---|---|---|---|
| Carr John R | $148,000 | -- | |
| Hagberg Jeffrey O | $105,000 | -- |
Source: Public Records
Mortgage History
| Date | Status | Borrower | Loan Amount |
|---|---|---|---|
| Open | Carr John R | $133,200 | |
| Previous Owner | Hagberg Jeffrey O | $105,000 |
Source: Public Records
Tax History Compared to Growth
Tax History
| Year | Tax Paid | Tax Assessment Tax Assessment Total Assessment is a certain percentage of the fair market value that is determined by local assessors to be the total taxable value of land and additions on the property. | Land | Improvement |
|---|---|---|---|---|
| 2024 | $6,731 | $93,185 | $17,598 | $75,587 |
| 2023 | $6,731 | $91,270 | $15,811 | $75,459 |
| 2022 | $6,794 | $86,364 | $14,961 | $71,403 |
| 2021 | $6,313 | $81,245 | $14,074 | $67,171 |
| 2020 | $6,591 | $81,245 | $14,074 | $67,171 |
| 2019 | $6,370 | $76,950 | $13,500 | $63,450 |
| 2018 | $6,453 | $76,050 | $13,500 | $62,550 |
| 2017 | $6,152 | $71,750 | $13,500 | $58,250 |
| 2016 | $6,484 | $68,400 | $13,500 | $54,900 |
| 2015 | $5,648 | $62,860 | $12,160 | $50,700 |
| 2014 | $5,648 | $60,468 | $12,160 | $48,308 |
| 2013 | $5,648 | $60,468 | $12,160 | $48,308 |
Source: Public Records
Map
Nearby Homes
- 22550 Woodside Dr
- 22405 S Cedar Dr
- 22426 S Remington Dr
- 22503 S Deal Ave
- 24349 W Camelot Rd
- 23058 W Mcclintock Rd
- 24556 W Lancelot Ln
- 22416 S Kings Ct
- 23906 S Frontage Rd
- 24317 Schubert Ln
- 24240 S Burr Rd
- 24304 S Frontage Rd W
- 21547 S Nadia Dr
- 24412 W Park River Ln
- 24646 W Eames St
- 21541 S River Rd
- 25200 W Pawnee Ln
- Sec8 W Eames St
- 24415 W Quail Dr
- 23550 S Vetter Rd
- 23752 W Mcclintock Rd
- 23800 W Mcclintock Rd
- 23742 W Mcclintock Rd
- 23812 W Mcclintock Rd
- 23753 W Mcclintock Rd
- 23765 W Mcclintock Rd
- 23732 W Mcclintock Rd
- 23822 W Mcclintock Rd
- 23801 W Mcclintock Rd
- 23725 W Mcclintock Rd
- 23722 W Mcclintock Rd
- 23834 W Mcclintock Rd
- 23823 W Mcclintock Rd
- 22935 S Kent Rd
- 23709 W Mcclintock Rd
- 23833 W Mcclintock Rd
- 23712 W Mcclintock Rd
- 22947 S Kent Rd
- 23844 W Mcclintock Rd
- 23744 W Essex Dr