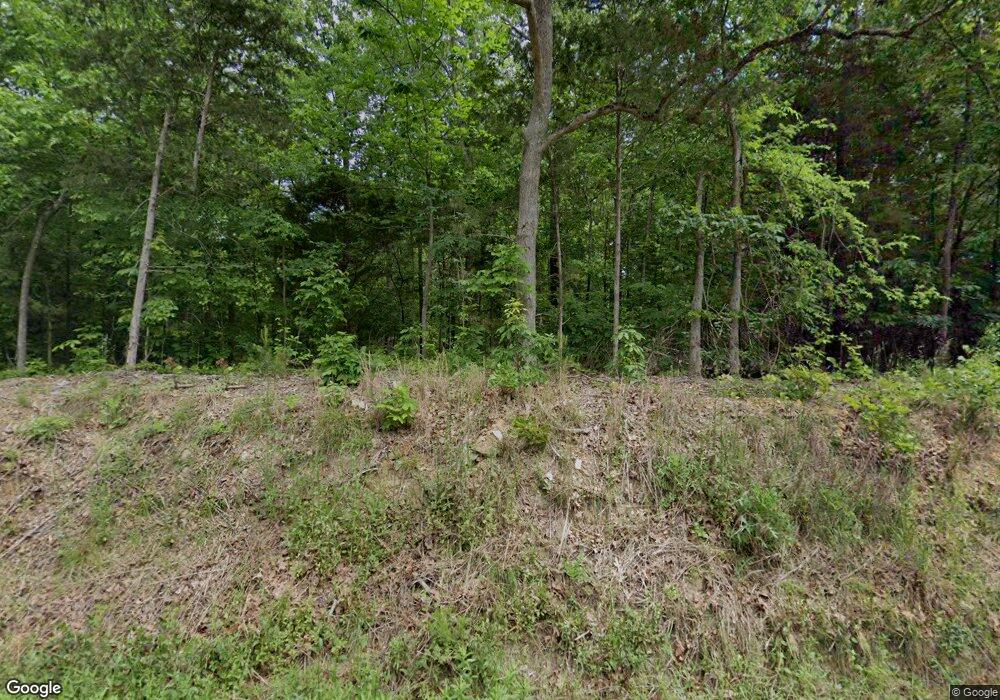
2377 Wessinger Rd Chapin, SC 29036
Estimated Value: $155,973
--
Bed
--
Bath
--
Sq Ft
5.03
Acres
About This Home
This home is located at 2377 Wessinger Rd, Chapin, SC 29036 and is currently estimated at $155,973. 2377 Wessinger Rd is a home located in Lexington County with nearby schools including Lake Murray Elementary School, Chapin Intermediate, and Chapin High School.
Ownership History
Date
Name
Owned For
Owner Type
Purchase Details
Closed on
May 11, 2021
Sold by
Burns Francis and Burns Debra
Bought by
Kumar Ashok and Kumar Shivani
Current Estimated Value
Home Financials for this Owner
Home Financials are based on the most recent Mortgage that was taken out on this home.
Original Mortgage
$97,750
Outstanding Balance
$88,586
Interest Rate
3.1%
Mortgage Type
Purchase Money Mortgage
Estimated Equity
$67,387
Purchase Details
Closed on
Oct 6, 2006
Sold by
Three Springs Llc
Bought by
Burns Francis and Burns Debra
Purchase Details
Closed on
Mar 19, 2004
Sold by
Ruilova Mark
Bought by
Three Springs Llc
Purchase Details
Closed on
Mar 12, 2004
Sold by
Studdard Jim L
Bought by
Flythe Rich T
Purchase Details
Closed on
Jun 25, 2002
Sold by
Richardson Ricky L
Bought by
Ruilova Mark
Purchase Details
Closed on
Jun 17, 2002
Sold by
Laurel Hill Dev Co Llc
Bought by
Werth Debby P
Purchase Details
Closed on
Jan 2, 2001
Sold by
Douglas Daniel J
Bought by
Richardson Ricky L
Create a Home Valuation Report for This Property
The Home Valuation Report is an in-depth analysis detailing your home's value as well as a comparison with similar homes in the area
Home Values in the Area
Average Home Value in this Area
Purchase History
| Date | Buyer | Sale Price | Title Company |
|---|---|---|---|
| Kumar Ashok | $115,000 | None Available | |
| Burns Francis | $98,000 | None Available | |
| Three Springs Llc | $47,800 | -- | |
| Flythe Rich T | $160,900 | -- | |
| Ruilova Mark | $50,000 | -- | |
| Werth Debby P | $146,350 | -- | |
| Richardson Ricky L | $49,900 | -- |
Source: Public Records
Mortgage History
| Date | Status | Borrower | Loan Amount |
|---|---|---|---|
| Open | Kumar Ashok | $97,750 |
Source: Public Records
Tax History Compared to Growth
Tax History
| Year | Tax Paid | Tax Assessment Tax Assessment Total Assessment is a certain percentage of the fair market value that is determined by local assessors to be the total taxable value of land and additions on the property. | Land | Improvement |
|---|---|---|---|---|
| 2024 | $8 | $20 | $20 | $0 |
| 2023 | $8 | $20 | $20 | $0 |
| 2022 | $8 | $20 | $20 | $0 |
| 2020 | $2,022 | $4,375 | $4,375 | $0 |
| 2019 | $1,695 | $3,804 | $3,804 | $0 |
| 2018 | $1,570 | $3,804 | $3,804 | $0 |
| 2017 | $1,557 | $3,804 | $3,804 | $0 |
| 2016 | $1,546 | $3,804 | $3,804 | $0 |
| 2014 | $1,326 | $3,400 | $3,400 | $0 |
| 2013 | -- | $3,400 | $3,400 | $0 |
Source: Public Records
Map
Nearby Homes
- 308 Grannys Cut Way
- 630 Basalt Ct
- 2515 Wessinger Rd
- The Bancroft Plan at Chapin Place
- 2544 Wessinger Rd
- 419 Dolomite Ct
- 2207 Wessinger Rd
- 444 Dolomite Ct
- 129 Forest Bickley Rd
- 110 Lake Hilton Dr
- 342 Chapin Place Way
- 306 Dolly Horn Ln
- 373 Chapin Place Way
- 551 Village Church Dr
- 138 Sunsation Dr
- 634 Basalt Ct
- 24 Clay Ct
- 275 Hilton Village Dr
- 366 Gallery Cliff Dr
- 720 Topline St
- 2357 Wessinger Rd
- 2423 Wessinger Rd
- 2367 Wessinger Rd
- 2437 Wessinger Rd
- 2347 Wessinger Rd
- 2025 Island Trail
- 2021 Island Trail
- 2410 Wessinger Rd
- 2037 Island Trail
- 2309 Wessinger Rd
- 2029 Island Trail
- 2045 Island Trail
- 202 Old Bush River Rd
- 2257 Wessinger Rd
- 416 Dolomite Ct
- 2049 Island Trail
- 2053 Island Trail
- 250 Chapin Place Way
- 2041 Island Trail
- 304 Granny's Cut Way