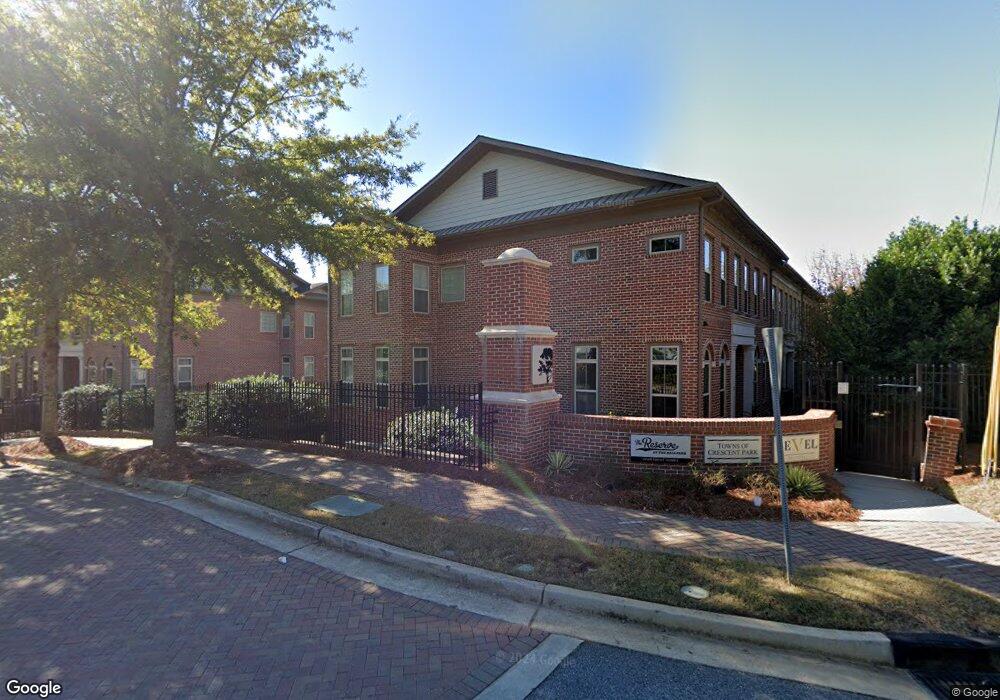
2378 Crescent Park Ct Unit 23 Atlanta, GA 30339
Estimated Value: $480,000 - $552,000
3
Beds
4
Baths
2,099
Sq Ft
$250/Sq Ft
Est. Value
About This Home
This home is located at 2378 Crescent Park Ct Unit 23, Atlanta, GA 30339 and is currently estimated at $524,179, approximately $249 per square foot. 2378 Crescent Park Ct Unit 23 is a home located in Cobb County with nearby schools including Brumby Elementary School, East Cobb Middle School, and Wheeler High School.
Ownership History
Date
Name
Owned For
Owner Type
Purchase Details
Closed on
May 24, 2024
Sold by
Quijano Julian Andres and Lopez-Pulido Clara Luisa
Bought by
Mckenzie Durand
Current Estimated Value
Home Financials for this Owner
Home Financials are based on the most recent Mortgage that was taken out on this home.
Original Mortgage
$125,000
Outstanding Balance
$117,949
Interest Rate
6.16%
Mortgage Type
New Conventional
Estimated Equity
$406,230
Purchase Details
Closed on
Dec 11, 2018
Sold by
Quijano Julian Andres
Bought by
Lopez-Pulido Clara Luisa and Quijano Julian Andres
Purchase Details
Closed on
Mar 26, 2013
Sold by
Barreneche Adriana
Bought by
Quijano Julian Andres
Purchase Details
Closed on
Dec 7, 2009
Sold by
Quijano Julian
Bought by
Quijano Julian and Barreneche Adriana
Home Financials for this Owner
Home Financials are based on the most recent Mortgage that was taken out on this home.
Original Mortgage
$252,890
Interest Rate
5.01%
Mortgage Type
New Conventional
Create a Home Valuation Report for This Property
The Home Valuation Report is an in-depth analysis detailing your home's value as well as a comparison with similar homes in the area
Home Values in the Area
Average Home Value in this Area
Purchase History
| Date | Buyer | Sale Price | Title Company |
|---|---|---|---|
| Mckenzie Durand | $540,000 | None Listed On Document | |
| Lopez-Pulido Clara Luisa | -- | -- | |
| Quijano Julian Andres | -- | -- | |
| Quijano Julian | -- | -- | |
| Quijano Julian | $252,900 | -- |
Source: Public Records
Mortgage History
| Date | Status | Borrower | Loan Amount |
|---|---|---|---|
| Open | Mckenzie Durand | $125,000 | |
| Previous Owner | Quijano Julian | $252,890 |
Source: Public Records
Tax History Compared to Growth
Tax History
| Year | Tax Paid | Tax Assessment Tax Assessment Total Assessment is a certain percentage of the fair market value that is determined by local assessors to be the total taxable value of land and additions on the property. | Land | Improvement |
|---|---|---|---|---|
| 2025 | $6,421 | $222,112 | $50,000 | $172,112 |
| 2024 | $6,697 | $222,112 | $50,000 | $172,112 |
| 2023 | $6,241 | $207,000 | $50,000 | $157,000 |
| 2022 | $5,363 | $176,692 | $36,000 | $140,692 |
| 2021 | $4,519 | $148,908 | $36,000 | $112,908 |
| 2020 | $4,519 | $148,908 | $36,000 | $112,908 |
| 2019 | $4,132 | $136,160 | $32,000 | $104,160 |
| 2018 | $3,712 | $136,160 | $32,000 | $104,160 |
| 2017 | $3,207 | $120,964 | $32,000 | $88,964 |
| 2016 | $3,208 | $120,964 | $32,000 | $88,964 |
| 2015 | $2,721 | $101,200 | $31,920 | $69,280 |
| 2014 | $2,744 | $101,200 | $0 | $0 |
Source: Public Records
Map
Nearby Homes
- 2790 Avington Ln SE
- 2801 Avington Ln SE
- 1205 Killarney SE
- 1279 Ridgecrest Ln SE
- 5136 Afton Way SE
- 1305 Ridgecrest Ln SE
- 5037 Bell Dr SE
- 5284 Afton Way SE
- 1138 Falling Water Dr SE
- 1024 Rohner Way
- 2736 Bell Dr SE
- 1350 Overlook Cove SE
- 2444 Rolling View Dr SE
- 2543 Oakbourne Ln
- 2555 Oakbourne Ln
- 2465 Spring Dr SE
- 1250 Parkwood Cir SE Unit 3204
- 1250 Parkwood Cir SE Unit 3001
- 1250 Parkwood Cir SE Unit 2312
- 1250 Parkwood Cir SE Unit 2201
- 2382 Crescent Park Ct Unit 21
- 2386 Crescent Park Ct Unit 19
- 2384 Crescent Park Ct Unit 20
- 2386 Crescent Park Ct Unit 419
- 2386 Crescent Park Ct Unit 2386
- 2380 Crescent Park Ct Unit 4
- 2384 Crescent Park Ct
- 2376 Crescent Park Ct
- 2378 Crescent Park Ct
- 2380 Crescent Park Ct
- 2382 Crescent Park Ct
- 2386 Crescent Park Ct
- 2400 Crescent Park Ct Unit 13
- 2390 Crescent Park Ct Unit 18
- 2396 Crescent Park Ct Unit 15
- 2392 Crescent Park Ct Unit 317
- 2392 Crescent Park Ct
- 2390 Crescent Park Ct
- 2392 Crescent Park Ct
- 2394 Crescent Park Ct