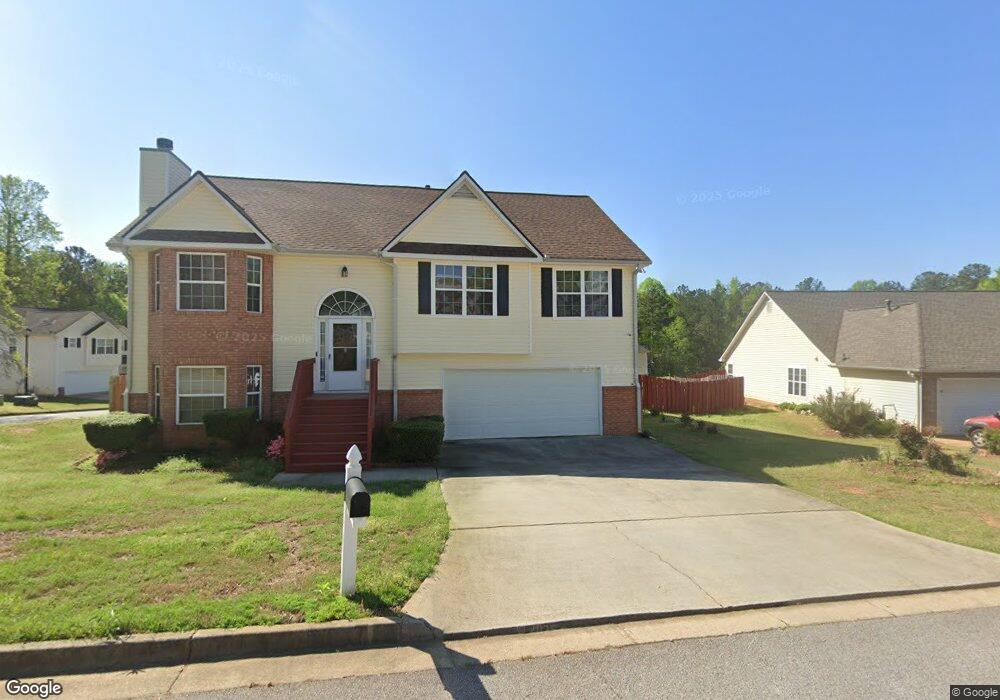
2378 Garnet Ave Unit 1 Riverdale, GA 30296
Estimated Value: $273,000 - $283,000
4
Beds
3
Baths
1,563
Sq Ft
$178/Sq Ft
Est. Value
About This Home
This home is located at 2378 Garnet Ave Unit 1, Riverdale, GA 30296 and is currently estimated at $278,583, approximately $178 per square foot. 2378 Garnet Ave Unit 1 is a home located in Fulton County with nearby schools including Nolan Elementary School, Mcnair Middle School, and Banneker High School.
Ownership History
Date
Name
Owned For
Owner Type
Purchase Details
Closed on
May 25, 2017
Sold by
Cousins Ridley
Bought by
Cousins Ridley and Carpenter Nadine
Current Estimated Value
Purchase Details
Closed on
Nov 16, 2010
Sold by
Talbot St Bk
Bought by
Jackson Patricia and Jackson Angelo
Home Financials for this Owner
Home Financials are based on the most recent Mortgage that was taken out on this home.
Original Mortgage
$152,211
Interest Rate
4.2%
Mortgage Type
New Conventional
Purchase Details
Closed on
Jun 1, 2010
Sold by
Simmons Constance
Bought by
Talbot St Bk
Purchase Details
Closed on
Jul 19, 2004
Sold by
Tim Jones Communities
Bought by
Simmons Constance
Home Financials for this Owner
Home Financials are based on the most recent Mortgage that was taken out on this home.
Original Mortgage
$133,952
Interest Rate
6.24%
Mortgage Type
New Conventional
Create a Home Valuation Report for This Property
The Home Valuation Report is an in-depth analysis detailing your home's value as well as a comparison with similar homes in the area
Home Values in the Area
Average Home Value in this Area
Purchase History
| Date | Buyer | Sale Price | Title Company |
|---|---|---|---|
| Cousins Ridley | $150,000 | -- | |
| Cousins Ridley | $150,000 | -- | |
| Jackson Patricia | $160,000 | -- | |
| Talbot St Bk | $123,872 | -- | |
| Simmons Constance | $167,500 | -- | |
| Tim Jones Communities Inc | $25,000 | -- |
Source: Public Records
Mortgage History
| Date | Status | Borrower | Loan Amount |
|---|---|---|---|
| Previous Owner | Jackson Patricia | $152,211 | |
| Previous Owner | Tim Jones Communities Inc | $133,952 |
Source: Public Records
Tax History Compared to Growth
Tax History
| Year | Tax Paid | Tax Assessment Tax Assessment Total Assessment is a certain percentage of the fair market value that is determined by local assessors to be the total taxable value of land and additions on the property. | Land | Improvement |
|---|---|---|---|---|
| 2025 | $578 | $119,840 | $24,280 | $95,560 |
| 2023 | $3,396 | $120,320 | $31,040 | $89,280 |
| 2022 | $682 | $94,280 | $17,120 | $77,160 |
| 2021 | $661 | $74,840 | $11,000 | $63,840 |
| 2020 | $658 | $72,640 | $9,280 | $63,360 |
| 2019 | $778 | $57,400 | $19,360 | $38,040 |
| 2018 | $2,232 | $56,080 | $18,920 | $37,160 |
| 2017 | $1,283 | $31,480 | $5,880 | $25,600 |
| 2016 | $1,283 | $31,480 | $5,880 | $25,600 |
| 2015 | $403 | $31,480 | $5,880 | $25,600 |
| 2014 | $403 | $31,480 | $5,880 | $25,600 |
Source: Public Records
Map
Nearby Homes
- 2367 Garnet Ave
- 2406 Garnet Ave
- 375 Sapphire Bend
- 2446 Garnet Ave
- 2454 West Rd
- 2754 Topaz Rd
- 279 Sapphire Bend
- 2350 Lake Royale Dr
- 2433 Wood Bend Ln
- 2655 West Rd
- 2565 Wood Bend Ln
- 0 Old National Hwy Unit 7196041
- 340 Kings Place
- 500 Kings Place
- 7455 Royal Ct
- 130 W Village Ct
- 7365 Royale Ln
- 7400 Royale Ln
- 6990 Old National Hwy
- 7050 Galloway Point
- 2378 Garnet Ave
- 2378 Garnet Ave Unit 15
- 420 Sapphire Bend
- 2382 Garnet Ave
- 2375 Garnet Ave
- 424 Sapphire Bend
- 415 Sapphire Bend
- 2379 Garnet Ave
- 2370 Garnet Ave
- 419 Sapphire Bend
- 2386 Garnet Ave
- 423 Sapphire Bend
- 752 Jasper Cove
- 396 Sapphire Bend
- 0 Jasper Cove Unit 7068489
- 0 Jasper Cove
- 2366 Garnet Ave
- 428 Sapphire Bend
- 2387 Garnet Ave
- 399 Sapphire Bend