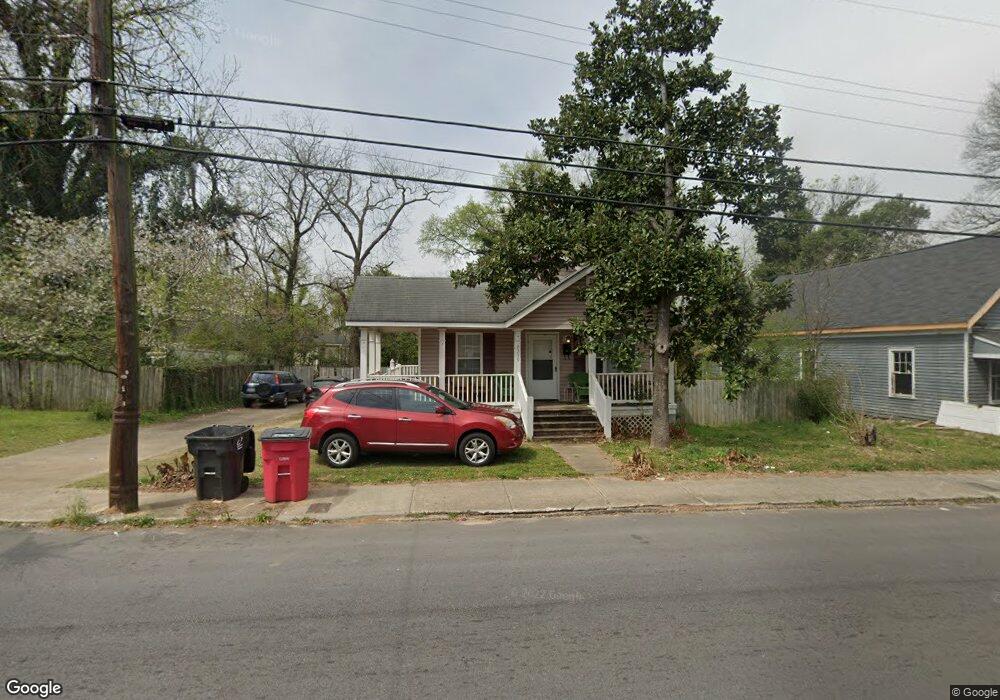
2379 2nd St Macon, GA 31206
Tindall Heights Historic District NeighborhoodEstimated Value: $87,000 - $113,727
3
Beds
2
Baths
1,056
Sq Ft
$92/Sq Ft
Est. Value
About This Home
This home is located at 2379 2nd St, Macon, GA 31206 and is currently estimated at $97,182, approximately $92 per square foot. 2379 2nd St is a home located in Bibb County with nearby schools including Ingram-Pye Elementary School, Central High School, and Cirrus Charter Academy.
Ownership History
Date
Name
Owned For
Owner Type
Purchase Details
Closed on
Oct 10, 2019
Sold by
Hjp Development Llc
Bought by
Jkkee Properties 2 Llc
Current Estimated Value
Purchase Details
Closed on
Dec 15, 2017
Sold by
Pruiett Cecil L and Pruiett Mary L
Bought by
Hjo Development Llc
Purchase Details
Closed on
Nov 20, 2009
Sold by
Res Distressed Asset Fund Ix Llc
Bought by
Pruiett Cecil L and Pruiett Mary L
Purchase Details
Closed on
Jun 8, 2009
Sold by
Wells Fargo Bank As Trustee
Bought by
Res Distressed Asset Fund Ix
Purchase Details
Closed on
Nov 4, 2008
Sold by
Taylor Rodney E
Bought by
Wells Fargo Bank As Trustee
Purchase Details
Closed on
Apr 25, 2002
Bought by
Taylor Rodney E
Create a Home Valuation Report for This Property
The Home Valuation Report is an in-depth analysis detailing your home's value as well as a comparison with similar homes in the area
Home Values in the Area
Average Home Value in this Area
Purchase History
| Date | Buyer | Sale Price | Title Company |
|---|---|---|---|
| Jkkee Properties 2 Llc | $44,000 | None Available | |
| Hjo Development Llc | $27,500 | None Available | |
| Pruiett Cecil L | $37,400 | Madison Title Agency | |
| Res Distressed Asset Fund Ix | $10,100 | -- | |
| Res Distressed Asset Fund Ix Llc | $10,133 | None Available | |
| Wells Fargo Bank As Trustee | $53,600 | -- | |
| Taylor Rodney E | $69,000 | -- |
Source: Public Records
Tax History Compared to Growth
Tax History
| Year | Tax Paid | Tax Assessment Tax Assessment Total Assessment is a certain percentage of the fair market value that is determined by local assessors to be the total taxable value of land and additions on the property. | Land | Improvement |
|---|---|---|---|---|
| 2025 | $849 | $34,559 | $2,000 | $32,559 |
| 2024 | $878 | $34,559 | $2,000 | $32,559 |
| 2023 | $878 | $34,559 | $2,000 | $32,559 |
| 2022 | $872 | $25,193 | $2,269 | $22,924 |
| 2021 | $957 | $25,193 | $2,269 | $22,924 |
| 2020 | $978 | $25,193 | $2,269 | $22,924 |
| 2019 | $986 | $25,193 | $2,269 | $22,924 |
| 2018 | $839 | $25,193 | $2,269 | $22,924 |
| 2017 | $944 | $25,193 | $2,269 | $22,924 |
| 2016 | $872 | $25,192 | $2,269 | $22,924 |
| 2015 | $1,234 | $25,192 | $2,269 | $22,924 |
| 2014 | $473 | $25,192 | $2,269 | $22,924 |
Source: Public Records
Map
Nearby Homes