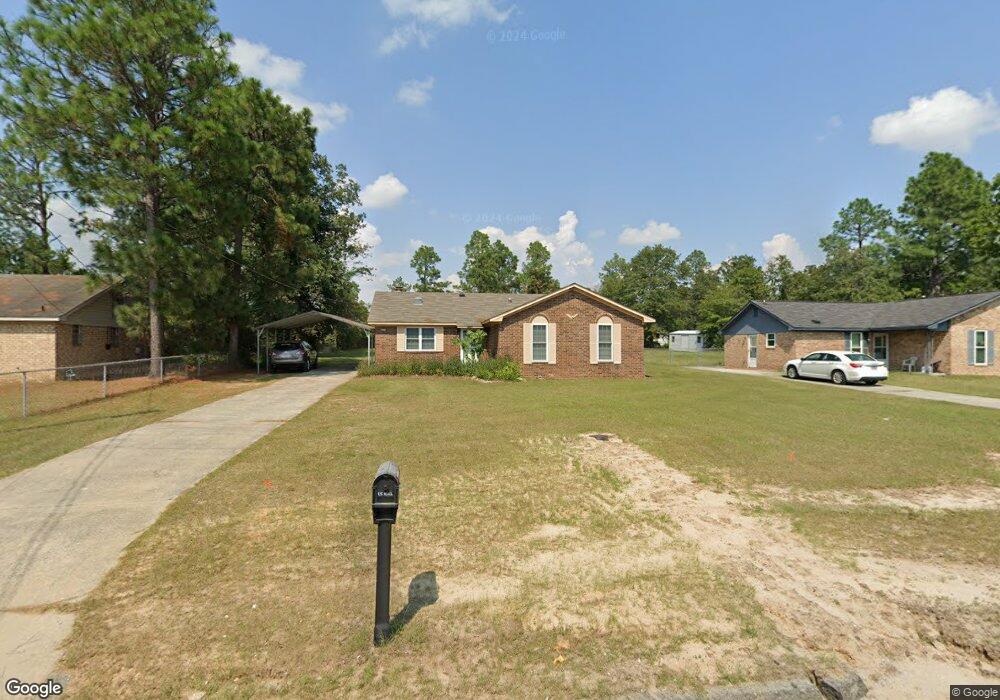
2379 Boykin Rd Augusta, GA 30906
Richmond Factory NeighborhoodEstimated Value: $151,437 - $164,000
3
Beds
2
Baths
1
Sq Ft
$157,609/Sq Ft
Est. Value
About This Home
This home is located at 2379 Boykin Rd, Augusta, GA 30906 and is currently estimated at $157,609, approximately $157,609 per square foot. 2379 Boykin Rd is a home located in Richmond County with nearby schools including Diamond Lakes Elementary School, Pine Hill Middle School, and Johnson Magnet.
Ownership History
Date
Name
Owned For
Owner Type
Purchase Details
Closed on
Oct 21, 1998
Sold by
Green Sun Hwa
Bought by
Holsomback John E
Current Estimated Value
Home Financials for this Owner
Home Financials are based on the most recent Mortgage that was taken out on this home.
Original Mortgage
$52,450
Outstanding Balance
$10,510
Interest Rate
6.76%
Mortgage Type
VA
Estimated Equity
$147,099
Purchase Details
Closed on
Jul 17, 1997
Sold by
Holsomback John E Green Sun Hwa Green S
Bought by
Holsomback John E Green Sun Hwa
Purchase Details
Closed on
Jun 23, 1997
Sold by
Holsomback John E
Bought by
Green Sun Hwa
Purchase Details
Closed on
Jun 18, 1997
Sold by
Holsomback John E
Bought by
Holsomback John E
Purchase Details
Closed on
Dec 1, 1983
Purchase Details
Closed on
Jan 1, 1983
Create a Home Valuation Report for This Property
The Home Valuation Report is an in-depth analysis detailing your home's value as well as a comparison with similar homes in the area
Home Values in the Area
Average Home Value in this Area
Purchase History
| Date | Buyer | Sale Price | Title Company |
|---|---|---|---|
| Holsomback John E | -- | -- | |
| Holsomback John E Green Sun Hwa | -- | -- | |
| Green Sun Hwa | -- | -- | |
| Holsomback John E | -- | -- | |
| Holsomback John E | -- | -- | |
| Green Sun Hwa | -- | -- | |
| Holsomback John E | $49,900 | -- | |
| -- | $35,300 | -- | |
| -- | $35,500 | -- |
Source: Public Records
Mortgage History
| Date | Status | Borrower | Loan Amount |
|---|---|---|---|
| Open | Holsomback John E | $52,450 |
Source: Public Records
Tax History
| Year | Tax Paid | Tax Assessment Tax Assessment Total Assessment is a certain percentage of the fair market value that is determined by local assessors to be the total taxable value of land and additions on the property. | Land | Improvement |
|---|---|---|---|---|
| 2025 | $848 | $56,504 | $3,427 | $53,077 |
| 2024 | $848 | $53,792 | $3,427 | $50,365 |
| 2023 | $773 | $53,852 | $3,427 | $50,425 |
| 2022 | $684 | $37,822 | $3,427 | $34,395 |
| 2021 | $593 | $27,036 | $3,424 | $23,612 |
| 2020 | $595 | $27,036 | $3,424 | $23,612 |
| 2019 | $610 | $27,036 | $3,424 | $23,612 |
| 2018 | $578 | $24,435 | $3,424 | $21,011 |
| 2017 | $542 | $24,435 | $3,424 | $21,011 |
| 2016 | $542 | $24,435 | $3,424 | $21,011 |
| 2015 | $542 | $24,435 | $3,424 | $21,011 |
| 2014 | $541 | $24,328 | $3,424 | $20,904 |
Source: Public Records
Map
Nearby Homes
- 2409 Boykin Rd
- 107 High Brass Way
- 2403 Travis Rd
- 4305 Parkwood Dr
- 4304 Parkwood Dr
- 4211 Stone Rd
- 4233 Cap Chat St
- 2412 Turkey Trail Dr
- 2104 Travis Rd
- 2383 Richwood Dr
- 3326 Stockport Dr
- 2323 Woodsman Dr
- 3366 Stockport Dr
- 3359 Stockport Dr
- 3367 Stockport Dr
- 4309 Windsor Spring Rd
- 2603 Ardwick Dr
- 2528 Inverness Dr
- 2806 Wyndham Dr
- 2807 Wyndham Dr
Your Personal Tour Guide
Ask me questions while you tour the home.