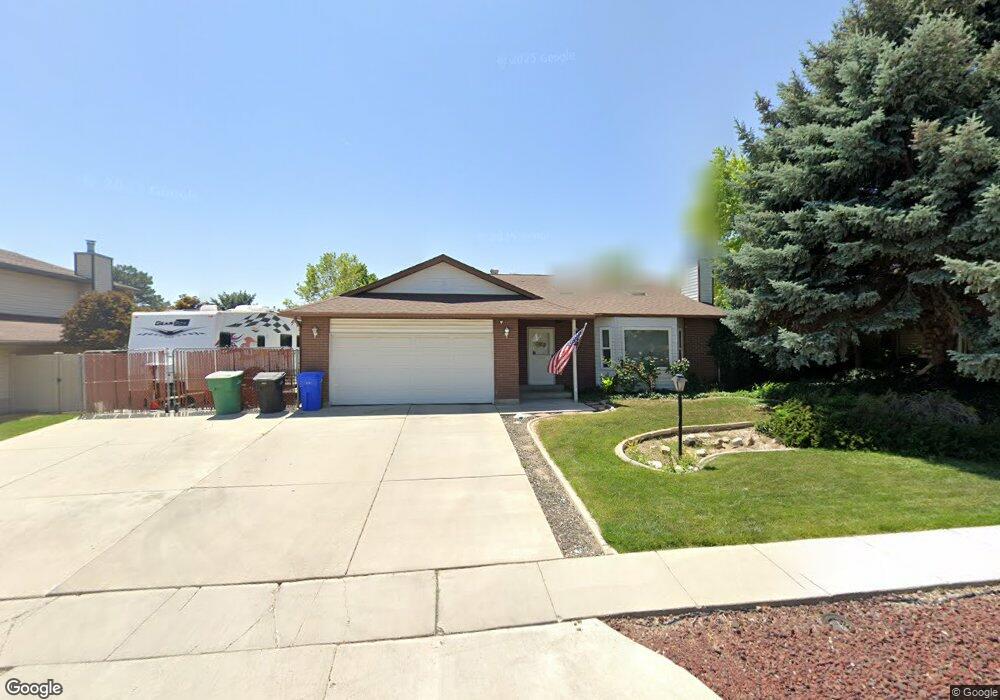
2379 Jordan Meadows Ln West Jordan, UT 84084
Estimated Value: $505,895 - $535,000
3
Beds
2
Baths
1,126
Sq Ft
$460/Sq Ft
Est. Value
About This Home
This home is located at 2379 Jordan Meadows Ln, West Jordan, UT 84084 and is currently estimated at $517,724, approximately $459 per square foot. 2379 Jordan Meadows Ln is a home located in Salt Lake County with nearby schools including West Jordan School, Westland Elementary School, and West Jordan Middle School.
Ownership History
Date
Name
Owned For
Owner Type
Purchase Details
Closed on
Jul 14, 2008
Sold by
Hurley Amy L and Hurley Cornelius D
Bought by
Brown Shawn W and Brown Tiffanie
Current Estimated Value
Home Financials for this Owner
Home Financials are based on the most recent Mortgage that was taken out on this home.
Original Mortgage
$225,461
Outstanding Balance
$145,452
Interest Rate
6.07%
Mortgage Type
FHA
Estimated Equity
$372,273
Purchase Details
Closed on
Jun 3, 2005
Sold by
Woodbury Brian W and Woodbury Lisa M
Bought by
Hurley Cornelius D and Hurley Amy L
Home Financials for this Owner
Home Financials are based on the most recent Mortgage that was taken out on this home.
Original Mortgage
$35,380
Interest Rate
5.72%
Mortgage Type
Credit Line Revolving
Create a Home Valuation Report for This Property
The Home Valuation Report is an in-depth analysis detailing your home's value as well as a comparison with similar homes in the area
Home Values in the Area
Average Home Value in this Area
Purchase History
| Date | Buyer | Sale Price | Title Company |
|---|---|---|---|
| Brown Shawn W | -- | United Title Services | |
| Hurley Cornelius D | -- | Merrill Title |
Source: Public Records
Mortgage History
| Date | Status | Borrower | Loan Amount |
|---|---|---|---|
| Open | Brown Shawn W | $225,461 | |
| Previous Owner | Hurley Cornelius D | $35,380 | |
| Previous Owner | Hurley Cornelius D | $141,520 |
Source: Public Records
Tax History Compared to Growth
Tax History
| Year | Tax Paid | Tax Assessment Tax Assessment Total Assessment is a certain percentage of the fair market value that is determined by local assessors to be the total taxable value of land and additions on the property. | Land | Improvement |
|---|---|---|---|---|
| 2025 | $2,420 | $481,900 | $138,800 | $343,100 |
| 2024 | $2,420 | $465,600 | $133,900 | $331,700 |
| 2023 | $2,317 | $420,100 | $127,500 | $292,600 |
| 2022 | $2,410 | $429,900 | $125,000 | $304,900 |
| 2021 | $2,024 | $328,700 | $102,000 | $226,700 |
| 2020 | $1,895 | $288,800 | $102,000 | $186,800 |
| 2019 | $1,906 | $284,800 | $102,000 | $182,800 |
| 2018 | $1,705 | $252,700 | $77,000 | $175,700 |
| 2017 | $1,592 | $235,000 | $77,000 | $158,000 |
| 2016 | $1,554 | $215,400 | $77,000 | $138,400 |
| 2015 | $1,557 | $210,500 | $88,000 | $122,500 |
| 2014 | $1,489 | $198,200 | $83,800 | $114,400 |
Source: Public Records
Map
Nearby Homes
- 2510 W Jordan Meadows Ln
- 2573 Jordan Meadows Ln
- 7647 S 2500 W
- 2386 W 7680 S
- 2169 W 7600 S
- 7361 S 2700 W
- 2062 W 7705 S
- 7645 S 1960 W
- 2312 W Hidden Bend Cove Unit 107
- 2886 W 7550 S
- 7721 Sunset Cir
- 1829 W 7600 S Unit G301
- 1829 W 7600 S Unit G303
- 1817 W 7600 S Unit I204
- 8026 Laguna Cir
- 1801 W 7600 S Unit C201
- 7942 S 2800 W
- 1805 W 7600 S Unit D204
- 1951 W 7125 S
- 7150 Camelot Way
- 2379 W Jordan Meadows Ln
- 2363 W Jordan Meadows Ln
- 2363 Jordan Meadows Ln
- 2393 Jordan Meadows Ln
- 2393 W Jordan Meadows Ln
- 2380 W 7530 S
- 2364 W 7530 S
- 2394 W 7530 S
- 2417 W Jordan Meadows Ln
- 2417 Jordan Meadows Ln
- 2382 Jordan Meadows Ln
- 2382 W Jordan Meadows Ln
- 7476 S 2345 W
- 2418 W 7530 S
- 2406 Jordan Meadows Ln
- 2337 Jordan Meadows Ln
- 2431 Jordan Meadows Ln
- 7521 S 2350 W
- 2379 W 7530 S
- 2432 W 7530 S