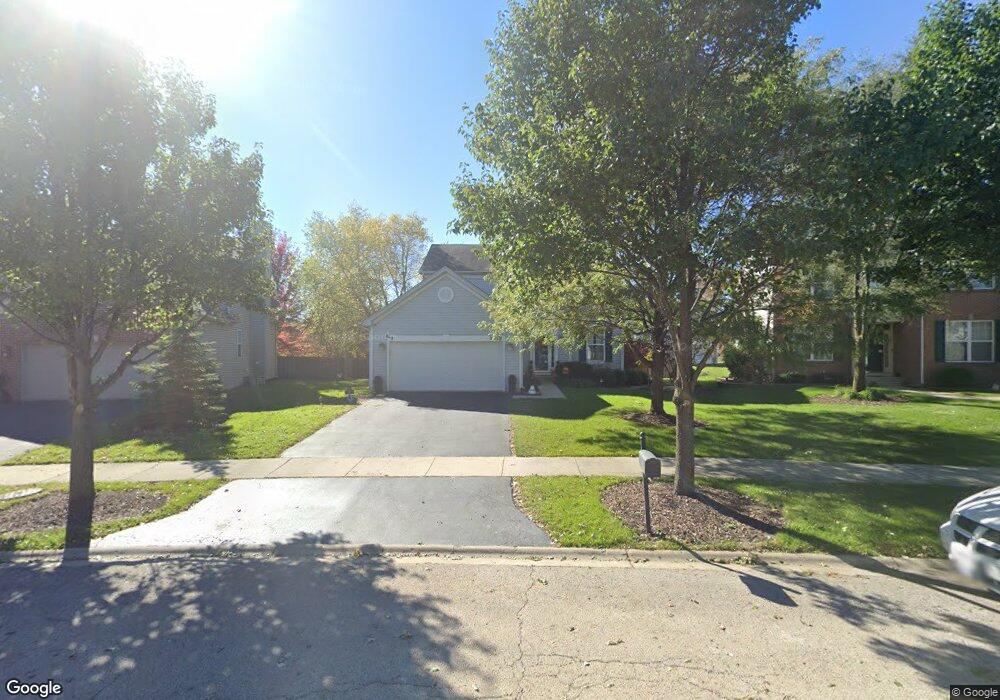
2379 Shadow Hills Ln Unit 1 Aurora, IL 60503
Far Southeast NeighborhoodEstimated Value: $446,000 - $510,000
3
Beds
3
Baths
2,199
Sq Ft
$214/Sq Ft
Est. Value
About This Home
This home is located at 2379 Shadow Hills Ln Unit 1, Aurora, IL 60503 and is currently estimated at $471,402, approximately $214 per square foot. 2379 Shadow Hills Ln Unit 1 is a home located in Will County with nearby schools including Wolfs Crossing Elementary School, Bednarcik Jr. High School, and Oswego East High School.
Ownership History
Date
Name
Owned For
Owner Type
Purchase Details
Closed on
Jul 22, 2011
Sold by
Childs Byron K and Turnauer Childs Allison
Bought by
May Rhonda K
Current Estimated Value
Home Financials for this Owner
Home Financials are based on the most recent Mortgage that was taken out on this home.
Original Mortgage
$225,630
Outstanding Balance
$156,974
Interest Rate
4.75%
Mortgage Type
FHA
Estimated Equity
$314,428
Purchase Details
Closed on
Dec 14, 2001
Sold by
The Ryland Group Inc
Bought by
Childs Byron K and Turnauer Childs Allison
Home Financials for this Owner
Home Financials are based on the most recent Mortgage that was taken out on this home.
Original Mortgage
$167,100
Interest Rate
7.16%
Create a Home Valuation Report for This Property
The Home Valuation Report is an in-depth analysis detailing your home's value as well as a comparison with similar homes in the area
Home Values in the Area
Average Home Value in this Area
Purchase History
| Date | Buyer | Sale Price | Title Company |
|---|---|---|---|
| May Rhonda K | $231,500 | Chicago Title Insurance Co | |
| Childs Byron K | $209,000 | Ticor Title |
Source: Public Records
Mortgage History
| Date | Status | Borrower | Loan Amount |
|---|---|---|---|
| Open | May Rhonda K | $225,630 | |
| Previous Owner | Childs Byron K | $167,100 |
Source: Public Records
Tax History Compared to Growth
Tax History
| Year | Tax Paid | Tax Assessment Tax Assessment Total Assessment is a certain percentage of the fair market value that is determined by local assessors to be the total taxable value of land and additions on the property. | Land | Improvement |
|---|---|---|---|---|
| 2024 | $10,197 | $124,987 | $23,259 | $101,728 |
| 2023 | $10,197 | $110,413 | $20,547 | $89,866 |
| 2022 | $8,855 | $94,983 | $19,437 | $75,546 |
| 2021 | $8,798 | $90,460 | $18,511 | $71,949 |
| 2020 | $8,422 | $89,460 | $18,218 | $71,242 |
| 2019 | $8,553 | $89,101 | $17,705 | $71,396 |
| 2018 | $8,484 | $83,546 | $17,315 | $66,231 |
| 2017 | $8,342 | $83,148 | $16,868 | $66,280 |
| 2016 | $8,556 | $81,358 | $16,505 | $64,853 |
| 2015 | $9,075 | $78,229 | $15,870 | $62,359 |
| 2014 | $9,075 | $77,710 | $15,870 | $61,840 |
| 2013 | $9,075 | $77,710 | $15,870 | $61,840 |
Source: Public Records
Map
Nearby Homes
- 2566 Rourke Dr
- 2532 Sagamore Cir
- 2413 Dickens Dr
- 2326 Sunshine Ln Unit 1969
- 2197 Wilson Creek Cir Unit 3
- 2357 Twilight Dr
- 2895 Lahinch Ct Unit 6
- 2969 Francis Ct
- 2495 Hafenrichter Rd
- 2310 Twilight Dr
- 1961 Wilson Creek Cir
- 2295 Twilight Dr
- 2735 Hillsboro Blvd Unit 3
- 2723 Hillsboro Blvd
- 600 Hawley Dr Unit 4346
- 2232 Daybreak Dr
- 2234 Daybreak Dr
- 1906 Indian Hill Ln Unit 4223
- 3302 Wildlight Rd
- 3328 Fulshear Cir
- 2373 Shadow Hills Ln
- 2385 Shadow Hills Ln Unit 1
- 2661 Red Hawk Ridge Dr Unit 1
- 2372 Shenandoah Dr Unit 2
- 2366 Shenandoah Dr Unit 2
- 2367 Shadow Hills Ln Unit 1
- 2360 Shenandoah Dr
- 2671 Red Hawk Ridge Dr Unit 1
- 2380 Shadow Hills Ln
- 2361 Shadow Hills Ln Unit 1
- 2354 Shenandoah Dr Unit 2
- 2368 Shadow Hills Ln
- 2362 Shadow Hills Ln Unit 1
- 2348 Shenandoah Dr
- 2644 Red Hawk Ridge Dr Unit 1
- 2355 Shadow Hills Ln Unit 1
- 2654 Red Hawk Ridge Dr Unit 1
- 2634 Red Hawk Ridge Dr
- 2664 Red Hawk Ridge Dr Unit 1
- 2356 Shadow Hills Ln