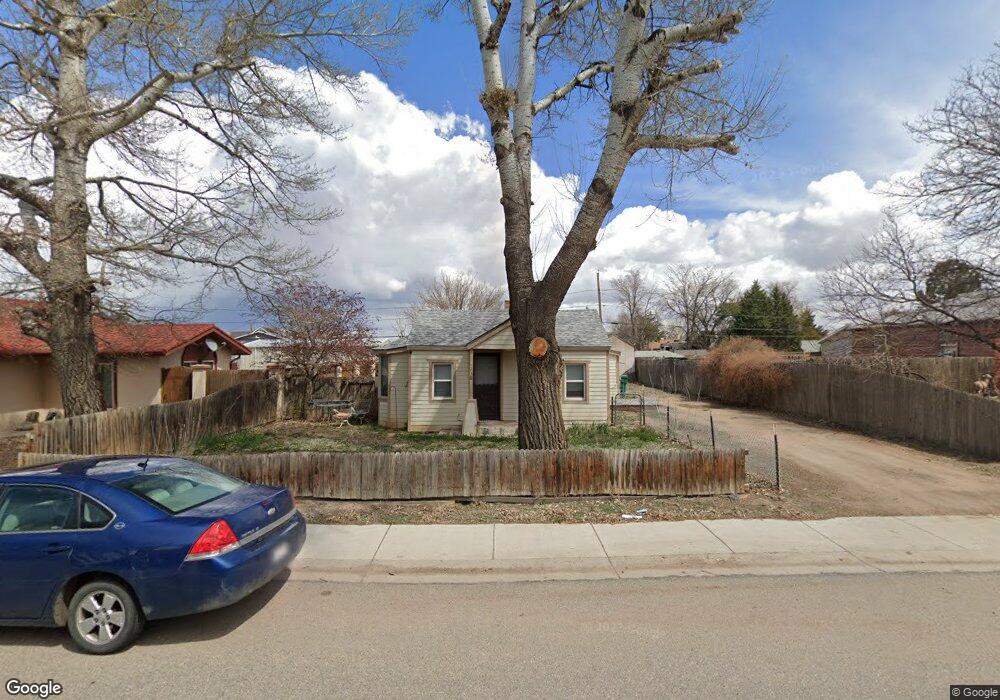
238 Ash St Hudson, CO 80642
Estimated Value: $300,205 - $333,000
2
Beds
1
Bath
812
Sq Ft
$383/Sq Ft
Est. Value
About This Home
This home is located at 238 Ash St, Hudson, CO 80642 and is currently estimated at $310,801, approximately $382 per square foot. 238 Ash St is a home located in Weld County with nearby schools including Weld Central Senior High School.
Ownership History
Date
Name
Owned For
Owner Type
Purchase Details
Closed on
Feb 18, 2021
Sold by
Carlson Cathee L
Bought by
Ubs Investments Llc
Current Estimated Value
Purchase Details
Closed on
Sep 22, 2011
Sold by
Bell James
Bought by
Carlson Cathee L
Purchase Details
Closed on
Aug 17, 2011
Sold by
Christensen Christine D
Bought by
Bell James
Purchase Details
Closed on
Mar 26, 2001
Sold by
Mumford James E and Mumford Heather C
Bought by
Christensen Christine D
Home Financials for this Owner
Home Financials are based on the most recent Mortgage that was taken out on this home.
Original Mortgage
$73,993
Interest Rate
6.98%
Mortgage Type
FHA
Purchase Details
Closed on
Jun 8, 1992
Sold by
Kilker Stephen R
Bought by
Mumford James E and Mumford Heather
Purchase Details
Closed on
Jul 24, 1989
Sold by
Freedom Federal Savings & Loan
Bought by
Kilker Stephen R
Purchase Details
Closed on
Apr 20, 1989
Purchase Details
Closed on
Aug 15, 1984
Create a Home Valuation Report for This Property
The Home Valuation Report is an in-depth analysis detailing your home's value as well as a comparison with similar homes in the area
Purchase History
| Date | Buyer | Sale Price | Title Company |
|---|---|---|---|
| Ubs Investments Llc | -- | None Available | |
| Carlson Cathee L | $37,880 | None Available | |
| Bell James | -- | None Available | |
| Christensen Christine D | $104,900 | Land Title | |
| Mumford James E | $33,000 | -- | |
| Kilker Stephen R | $14,500 | -- | |
| -- | -- | -- | |
| -- | -- | -- | |
| Hastman Michael | $41,000 | -- |
Source: Public Records
Mortgage History
| Date | Status | Borrower | Loan Amount |
|---|---|---|---|
| Previous Owner | Christensen Christine D | $73,993 |
Source: Public Records
Tax History
| Year | Tax Paid | Tax Assessment Tax Assessment Total Assessment is a certain percentage of the fair market value that is determined by local assessors to be the total taxable value of land and additions on the property. | Land | Improvement |
|---|---|---|---|---|
| 2025 | $1,616 | $21,190 | $4,220 | $16,970 |
| 2024 | $1,616 | $21,190 | $4,220 | $16,970 |
| 2023 | $1,553 | $23,020 | $4,740 | $18,280 |
| 2022 | $1,413 | $16,670 | $3,480 | $13,190 |
| 2021 | $1,505 | $17,140 | $3,580 | $13,560 |
| 2020 | $1,197 | $14,130 | $2,500 | $11,630 |
| 2019 | $1,236 | $14,130 | $2,500 | $11,630 |
| 2018 | $1,121 | $12,550 | $2,740 | $9,810 |
| 2017 | $1,079 | $12,550 | $2,740 | $9,810 |
| 2016 | $778 | $8,980 | $2,790 | $6,190 |
| 2015 | $688 | $8,980 | $2,790 | $6,190 |
| 2014 | $359 | $4,630 | $1,190 | $3,440 |
Source: Public Records
Map
Nearby Homes
- 608 Cedar St
- 218 Grape St Unit 28
- 218 Grape St Unit 29
- 218 St Unit 29
- 450 Wyatt Dr
- 210 Dawn Dr
- 508 Hickory St
- 240 Buckboard Dr
- 250 Buckboard Dr
- 22385 Highway 52
- 220 Dawn Dr
- 450 Buckboard Dr
- 450 Lexi Ln
- 500 Gavin Ct
- 450 Buckboard Ln
- 3849 Kenai St
- 22400 County Road 10
- 21350 County Road 10
- 6000 County Road 43 1 2
- 3127 County Road 49
Your Personal Tour Guide
Ask me questions while you tour the home.