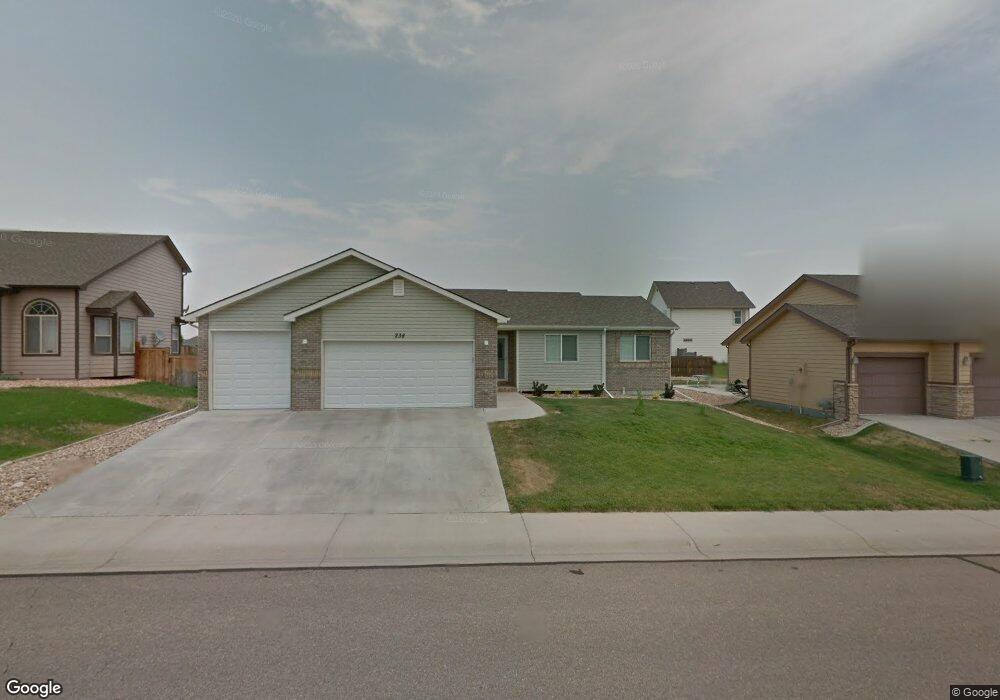
238 Aspen Grove Way Severance, CO 80550
Estimated Value: $451,000 - $492,000
3
Beds
2
Baths
1,360
Sq Ft
$340/Sq Ft
Est. Value
About This Home
This home is located at 238 Aspen Grove Way, Severance, CO 80550 and is currently estimated at $461,908, approximately $339 per square foot. 238 Aspen Grove Way is a home located in Weld County with nearby schools including Range View Elementary School, Severance Middle School, and Windsor High School.
Ownership History
Date
Name
Owned For
Owner Type
Purchase Details
Closed on
Feb 18, 2005
Sold by
Executive Homes Inc
Bought by
Eccles Wayne M
Current Estimated Value
Home Financials for this Owner
Home Financials are based on the most recent Mortgage that was taken out on this home.
Original Mortgage
$162,400
Outstanding Balance
$82,925
Interest Rate
5.82%
Mortgage Type
Unknown
Estimated Equity
$378,983
Purchase Details
Closed on
Oct 29, 2004
Sold by
Timber Ridge Severance Ii Llc
Bought by
Executive Homes Inc
Create a Home Valuation Report for This Property
The Home Valuation Report is an in-depth analysis detailing your home's value as well as a comparison with similar homes in the area
Home Values in the Area
Average Home Value in this Area
Purchase History
| Date | Buyer | Sale Price | Title Company |
|---|---|---|---|
| Eccles Wayne M | $203,042 | Security Title | |
| Executive Homes Inc | $38,770 | -- |
Source: Public Records
Mortgage History
| Date | Status | Borrower | Loan Amount |
|---|---|---|---|
| Open | Eccles Wayne M | $162,400 |
Source: Public Records
Tax History Compared to Growth
Tax History
| Year | Tax Paid | Tax Assessment Tax Assessment Total Assessment is a certain percentage of the fair market value that is determined by local assessors to be the total taxable value of land and additions on the property. | Land | Improvement |
|---|---|---|---|---|
| 2025 | $1,952 | $26,800 | $5,690 | $21,110 |
| 2024 | $1,952 | $26,800 | $5,690 | $21,110 |
| 2023 | $1,793 | $30,930 | $5,890 | $25,040 |
| 2022 | $1,590 | $23,160 | $4,660 | $18,500 |
| 2021 | $1,483 | $23,830 | $4,790 | $19,040 |
| 2020 | $1,356 | $22,700 | $3,580 | $19,120 |
| 2019 | $1,344 | $22,700 | $3,580 | $19,120 |
| 2018 | $1,164 | $19,940 | $2,810 | $17,130 |
| 2017 | $1,231 | $19,940 | $2,810 | $17,130 |
| 2016 | $1,692 | $17,680 | $2,470 | $15,210 |
| 2015 | $1,575 | $17,680 | $2,470 | $15,210 |
| 2014 | $1,444 | $15,210 | $2,070 | $13,140 |
Source: Public Records
Map
Nearby Homes
- 934 Cliffrose Way
- 515 Limber Pine Ct
- 205 Timber Ridge Ct
- 623 Foxtail Way
- 431 Ptarmigan St
- 368 Mt Bross Ave
- 562 Ellingwood Pointe Dr
- HENLEY Plan at Cottages at Tailholt
- BRIDGEPORT Plan at Cottages at Tailholt
- PENDLETON Plan at Cottages at Tailholt
- ELDER Plan at Cottages at Tailholt
- CHATHAM Plan at Cottages at Tailholt
- LEXINGTON Plan at Cottages at Tailholt
- NEW HAVEN Plan at Cottages at Tailholt
- NEWCASTLE Plan at Cottages at Tailholt
- 104 Arapaho St
- 309 Audubon Blvd
- 719 Elk Mountain Dr
- 381 Mt Bross Ave
- 727 Elk Mountain Dr
- 236 Aspen Grove Way
- 240 Aspen Grove Way
- 409 Timber Ridge Pkwy
- 1512 Ponderosa Dr
- 407 Timber Ridge Pkwy
- 239 Aspen Grove Way
- 241 Aspen Grove Way
- 237 Aspen Grove Way
- 235 Aspen Grove Way
- 234 Aspen Grove Way
- 232 Aspen Grove Way
- 502 Aspen Grove Way
- 233 Aspen Grove Way
- 501 Timber Ridge Pkwy
- 414 Prairie Clover Way
- 403 Timber Ridge Pkwy
- 416 Prairie Clover Way
- 412 Prairie Clover Way
- 501 Aspen Grove Way
- 1510 Ponderosa Dr