Estimated Value: $342,000 - $357,000
4
Beds
3
Baths
2,153
Sq Ft
$162/Sq Ft
Est. Value
About This Home
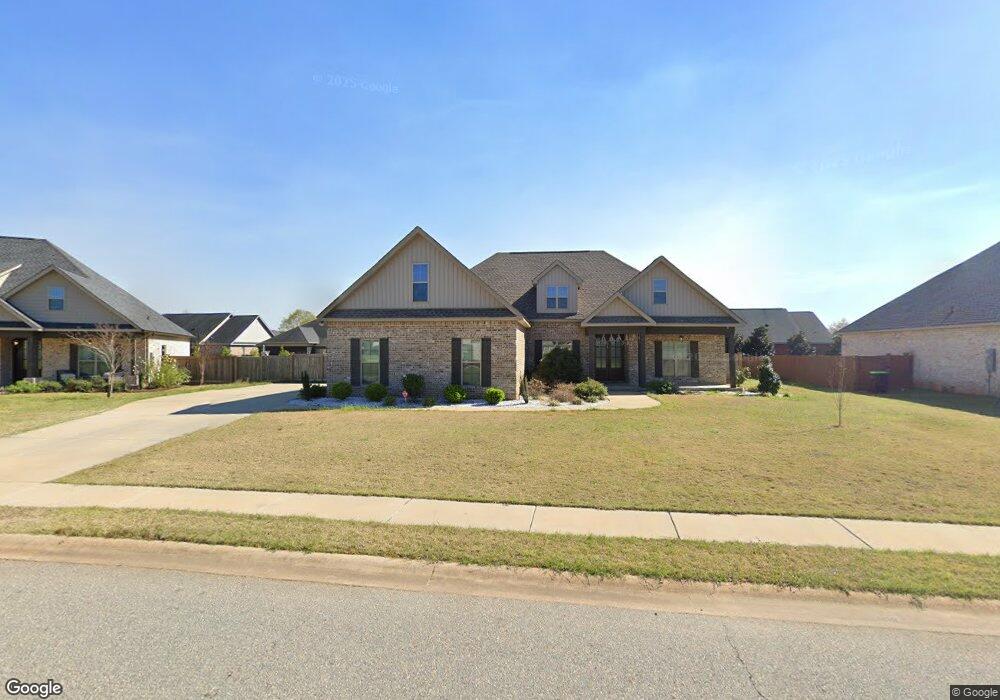
This home is located at 238 Caleb Way Unit 32G, Byron, GA 31008 and is currently estimated at $348,742, approximately $161 per square foot. 238 Caleb Way Unit 32G is a home located in Peach County with nearby schools including Byron Elementary School, Byron Middle School, and Peach County High School.
Ownership History
Date
Name
Owned For
Owner Type
Purchase Details
Closed on
Oct 19, 2021
Sold by
Alexis Investments Llc
Bought by
Prestige Builders Grp Llc
Current Estimated Value
Purchase Details
Closed on
Jan 28, 2021
Sold by
Trinity Built Homes Llc
Bought by
Khadka Pratima
Home Financials for this Owner
Home Financials are based on the most recent Mortgage that was taken out on this home.
Original Mortgage
$223,929
Interest Rate
2.6%
Mortgage Type
New Conventional
Purchase Details
Closed on
May 14, 2020
Sold by
Alexis Investments Llc
Bought by
Caleb Properties Llc
Purchase Details
Closed on
Feb 24, 2011
Sold by
Newton Development Llc
Bought by
Alexis Investments Llc
Purchase Details
Closed on
Aug 11, 2008
Sold by
Preston Development Llc
Bought by
Newton Development Llc
Purchase Details
Closed on
Jul 26, 2006
Bought by
Preston Development Llc
Create a Home Valuation Report for This Property
The Home Valuation Report is an in-depth analysis detailing your home's value as well as a comparison with similar homes in the area
Home Values in the Area
Average Home Value in this Area
Purchase History
| Date | Buyer | Sale Price | Title Company |
|---|---|---|---|
| Prestige Builders Grp Llc | $325,000 | -- | |
| Khadka Pratima | $248,810 | -- | |
| Trinity Built Homes Llc | -- | -- | |
| Caleb Properties Llc | $40,000 | -- | |
| Alexis Investments Llc | -- | -- | |
| Newton Development Llc | -- | -- | |
| Preston Development Llc | -- | -- |
Source: Public Records
Mortgage History
| Date | Status | Borrower | Loan Amount |
|---|---|---|---|
| Previous Owner | Trinity Built Homes Llc | $223,929 |
Source: Public Records
Tax History Compared to Growth
Tax History
| Year | Tax Paid | Tax Assessment Tax Assessment Total Assessment is a certain percentage of the fair market value that is determined by local assessors to be the total taxable value of land and additions on the property. | Land | Improvement |
|---|---|---|---|---|
| 2024 | $4,701 | $133,240 | $12,480 | $120,760 |
| 2023 | $4,655 | $131,080 | $10,000 | $121,080 |
| 2022 | $2,679 | $113,160 | $7,000 | $106,160 |
| 2021 | $2,936 | $94,040 | $7,000 | $87,040 |
| 2020 | $152 | $4,880 | $4,880 | $0 |
| 2019 | $153 | $4,880 | $4,880 | $0 |
| 2018 | $154 | $4,880 | $4,880 | $0 |
| 2017 | $155 | $4,880 | $4,880 | $0 |
| 2016 | $154 | $4,880 | $4,880 | $0 |
| 2015 | $154 | $4,880 | $4,880 | $0 |
| 2014 | $154 | $4,880 | $4,880 | $0 |
| 2013 | -- | $4,880 | $4,880 | $0 |
Source: Public Records
Map
Nearby Homes
- 217 Caleb Way
- 260 Caleb Way
- 125 Amber Dr
- 205 Burr Dr
- 104 Monroe Ct
- 105 Browning Point
- 102 Monroe Ct
- 107 Monroe Ct
- 100 Monroe Ct
- 508 Georgian Walk
- 302 Arrie Dr
- 506 Georgian Walk
- 706 Georgian Walk
- 721 Georgian Walk
- 732 Georgian Walk
- 412 Lamplight Dr
- 417 Covington Cove
- 104 Manchester Ln
- 116 Bulloch Ct
- 106 Coventry Manor Ct