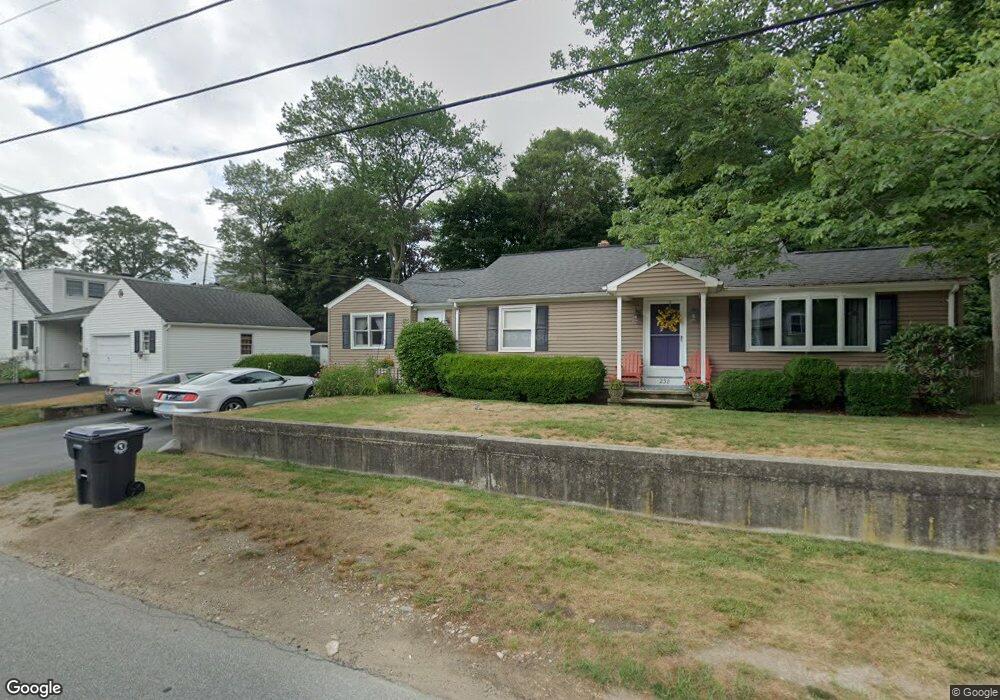
238 Curran Rd Cumberland, RI 02864
Monastery Heights NeighborhoodEstimated Value: $444,000 - $511,000
2
Beds
1
Bath
1,301
Sq Ft
$362/Sq Ft
Est. Value
About This Home
This home is located at 238 Curran Rd, Cumberland, RI 02864 and is currently estimated at $471,612, approximately $362 per square foot. 238 Curran Rd is a home located in Providence County with nearby schools including Garvin Memorial School, Joseph L. McCourt Middle School, and Cumberland High School.
Ownership History
Date
Name
Owned For
Owner Type
Purchase Details
Closed on
Jan 15, 2025
Sold by
Mccarthy David J and Mccarthy Lyn
Bought by
Mccarthy Ft and Gomes
Current Estimated Value
Purchase Details
Closed on
Aug 29, 1986
Bought by
Mccarthy David J and Mccarthy Lyn
Create a Home Valuation Report for This Property
The Home Valuation Report is an in-depth analysis detailing your home's value as well as a comparison with similar homes in the area
Home Values in the Area
Average Home Value in this Area
Purchase History
| Date | Buyer | Sale Price | Title Company |
|---|---|---|---|
| Mccarthy Ft | -- | None Available | |
| Mccarthy Ft | -- | None Available | |
| Mccarthy David J | -- | -- |
Source: Public Records
Mortgage History
| Date | Status | Borrower | Loan Amount |
|---|---|---|---|
| Previous Owner | Mccarthy David J | $40,100 | |
| Previous Owner | Mccarthy David J | $53,205 | |
| Previous Owner | Mccarthy David J | $72,000 |
Source: Public Records
Tax History
| Year | Tax Paid | Tax Assessment Tax Assessment Total Assessment is a certain percentage of the fair market value that is determined by local assessors to be the total taxable value of land and additions on the property. | Land | Improvement |
|---|---|---|---|---|
| 2025 | $3,984 | $324,700 | $141,400 | $183,300 |
| 2024 | $3,880 | $324,700 | $141,400 | $183,300 |
| 2023 | $3,773 | $324,700 | $141,400 | $183,300 |
| 2022 | $3,685 | $245,800 | $98,900 | $146,900 |
| 2021 | $3,623 | $245,800 | $98,900 | $146,900 |
| 2020 | $3,520 | $245,800 | $98,900 | $146,900 |
| 2019 | $3,295 | $207,500 | $82,500 | $125,000 |
| 2018 | $3,200 | $207,500 | $82,500 | $125,000 |
| 2017 | $3,156 | $207,500 | $82,500 | $125,000 |
| 2016 | $2,697 | $157,900 | $74,800 | $83,100 |
| 2015 | $2,697 | $157,900 | $74,800 | $83,100 |
| 2014 | $5,768 | $157,900 | $74,800 | $83,100 |
| 2013 | $2,934 | $185,900 | $76,800 | $109,100 |
Source: Public Records
Map
Nearby Homes
- 15 Susan Dr
- 163 Woodside Ave
- 11 Woodside Ave
- 789 High St
- 0 Adamsdale Rd
- 0 Mendon Road (Rear)
- 52 Montclair Dr
- 27 Norman St
- 98 Iroquois Rd
- 0 Longview Dr
- 00 Mendon Rd
- 18 Haduk Dr
- 51 Pequot Ave
- 24 Narragansett Ave
- 0 Narragansett Rd
- 33 Kent St
- 18 Cumberland St
- 50 Blackstone St
- 18 Narragansett Ave
- 15 E Earle St
Your Personal Tour Guide
Ask me questions while you tour the home.